Practical Binary Classification Model Comparison in Python

This project focuses on the practical comparison of supervised machine learning classification models using Python.

The aim was not only to identify strong-performing models, but also to understand how different classification algorithms behave when applied to the same prediction task, and how predictive performance, probability estimates, computational efficiency and practical usability influence model selection.

Featured Project: Predicting a Diamond Clarity Group
The project uses structured diamond data to predict whether a diamond belongs to a higher clarity group.

This binary classification problem provided a practical way to compare a wide range of classification algorithms using a consistent machine learning workflow.

The comparison includes baseline models, linear classifiers, nearest-neighbour methods, tree-based models, ensemble methods, boosting algorithms and other supervised classification approaches.

Rather than relying on a single accuracy score, the project evaluates models using multiple classification metrics and examines their prediction behaviour, probability estimates, runtime and practical suitability.

What the Project Includes

The project demonstrates a complete supervised binary classification workflow, including:

Model Comparison Approach

A consistent experimental structure was used across the different classification models.

Models were trained and evaluated using the same prepared dataset and comparable evaluation procedures. Selected models were then investigated further through cross-validation and hyperparameter tuning before final evaluation on previously unseen test data.

The comparison considers multiple aspects of classification performance rather than relying only on overall accuracy.

This makes it possible to examine how models differ in their ability to distinguish between the two classes, how confidently they make predictions, and what trade-offs exist between predictive performance, computational requirements and practical usability.

Model Performance Comparison

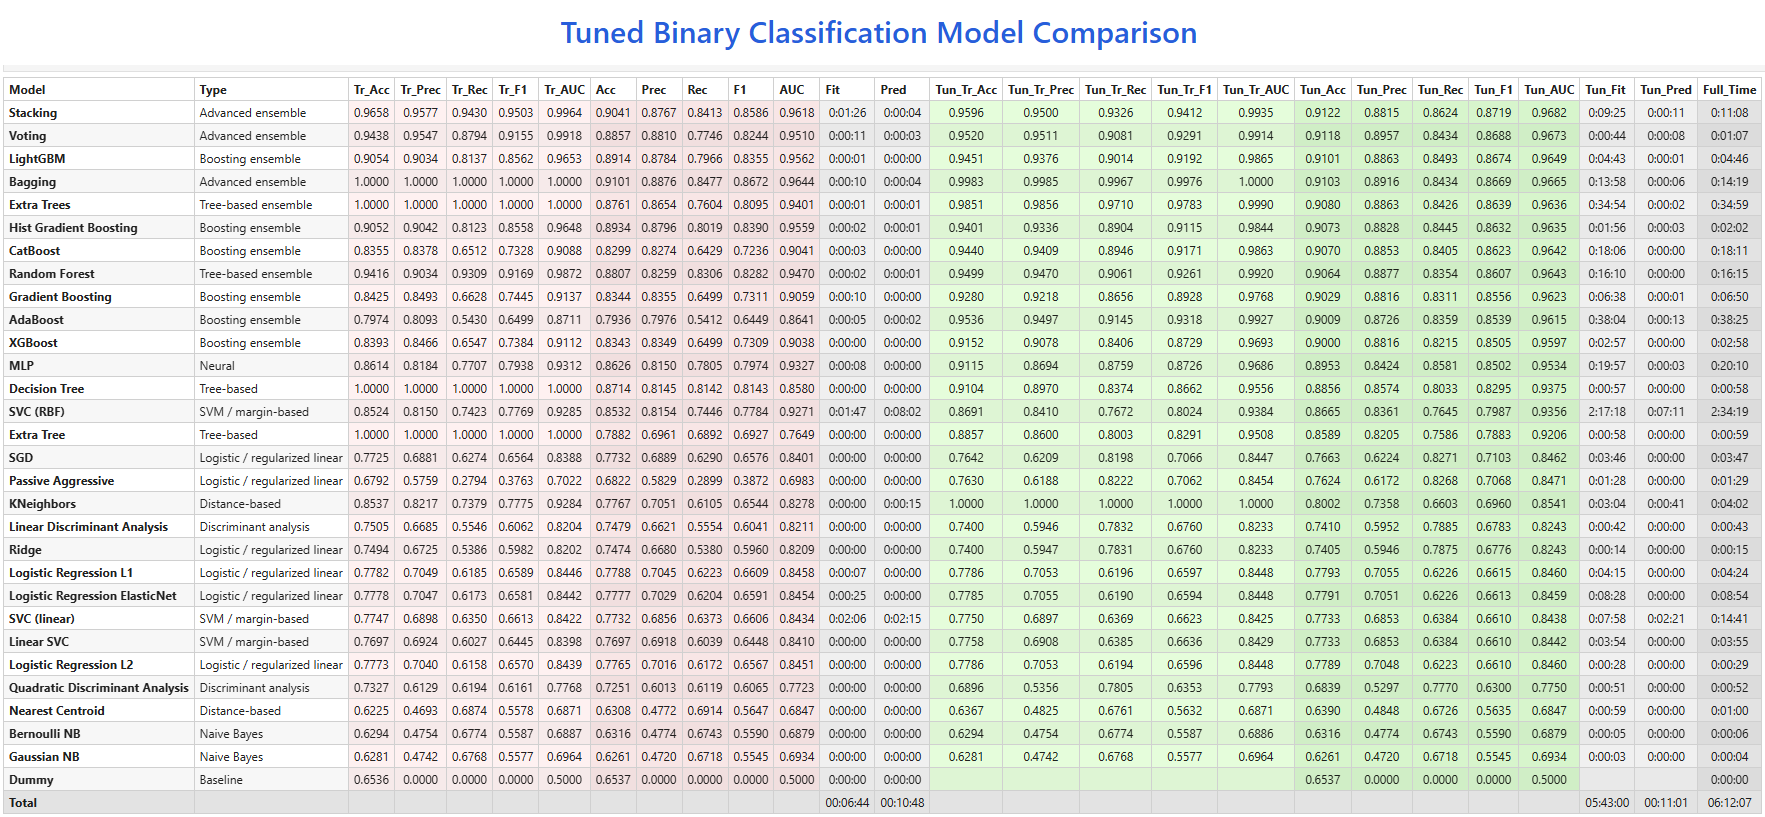
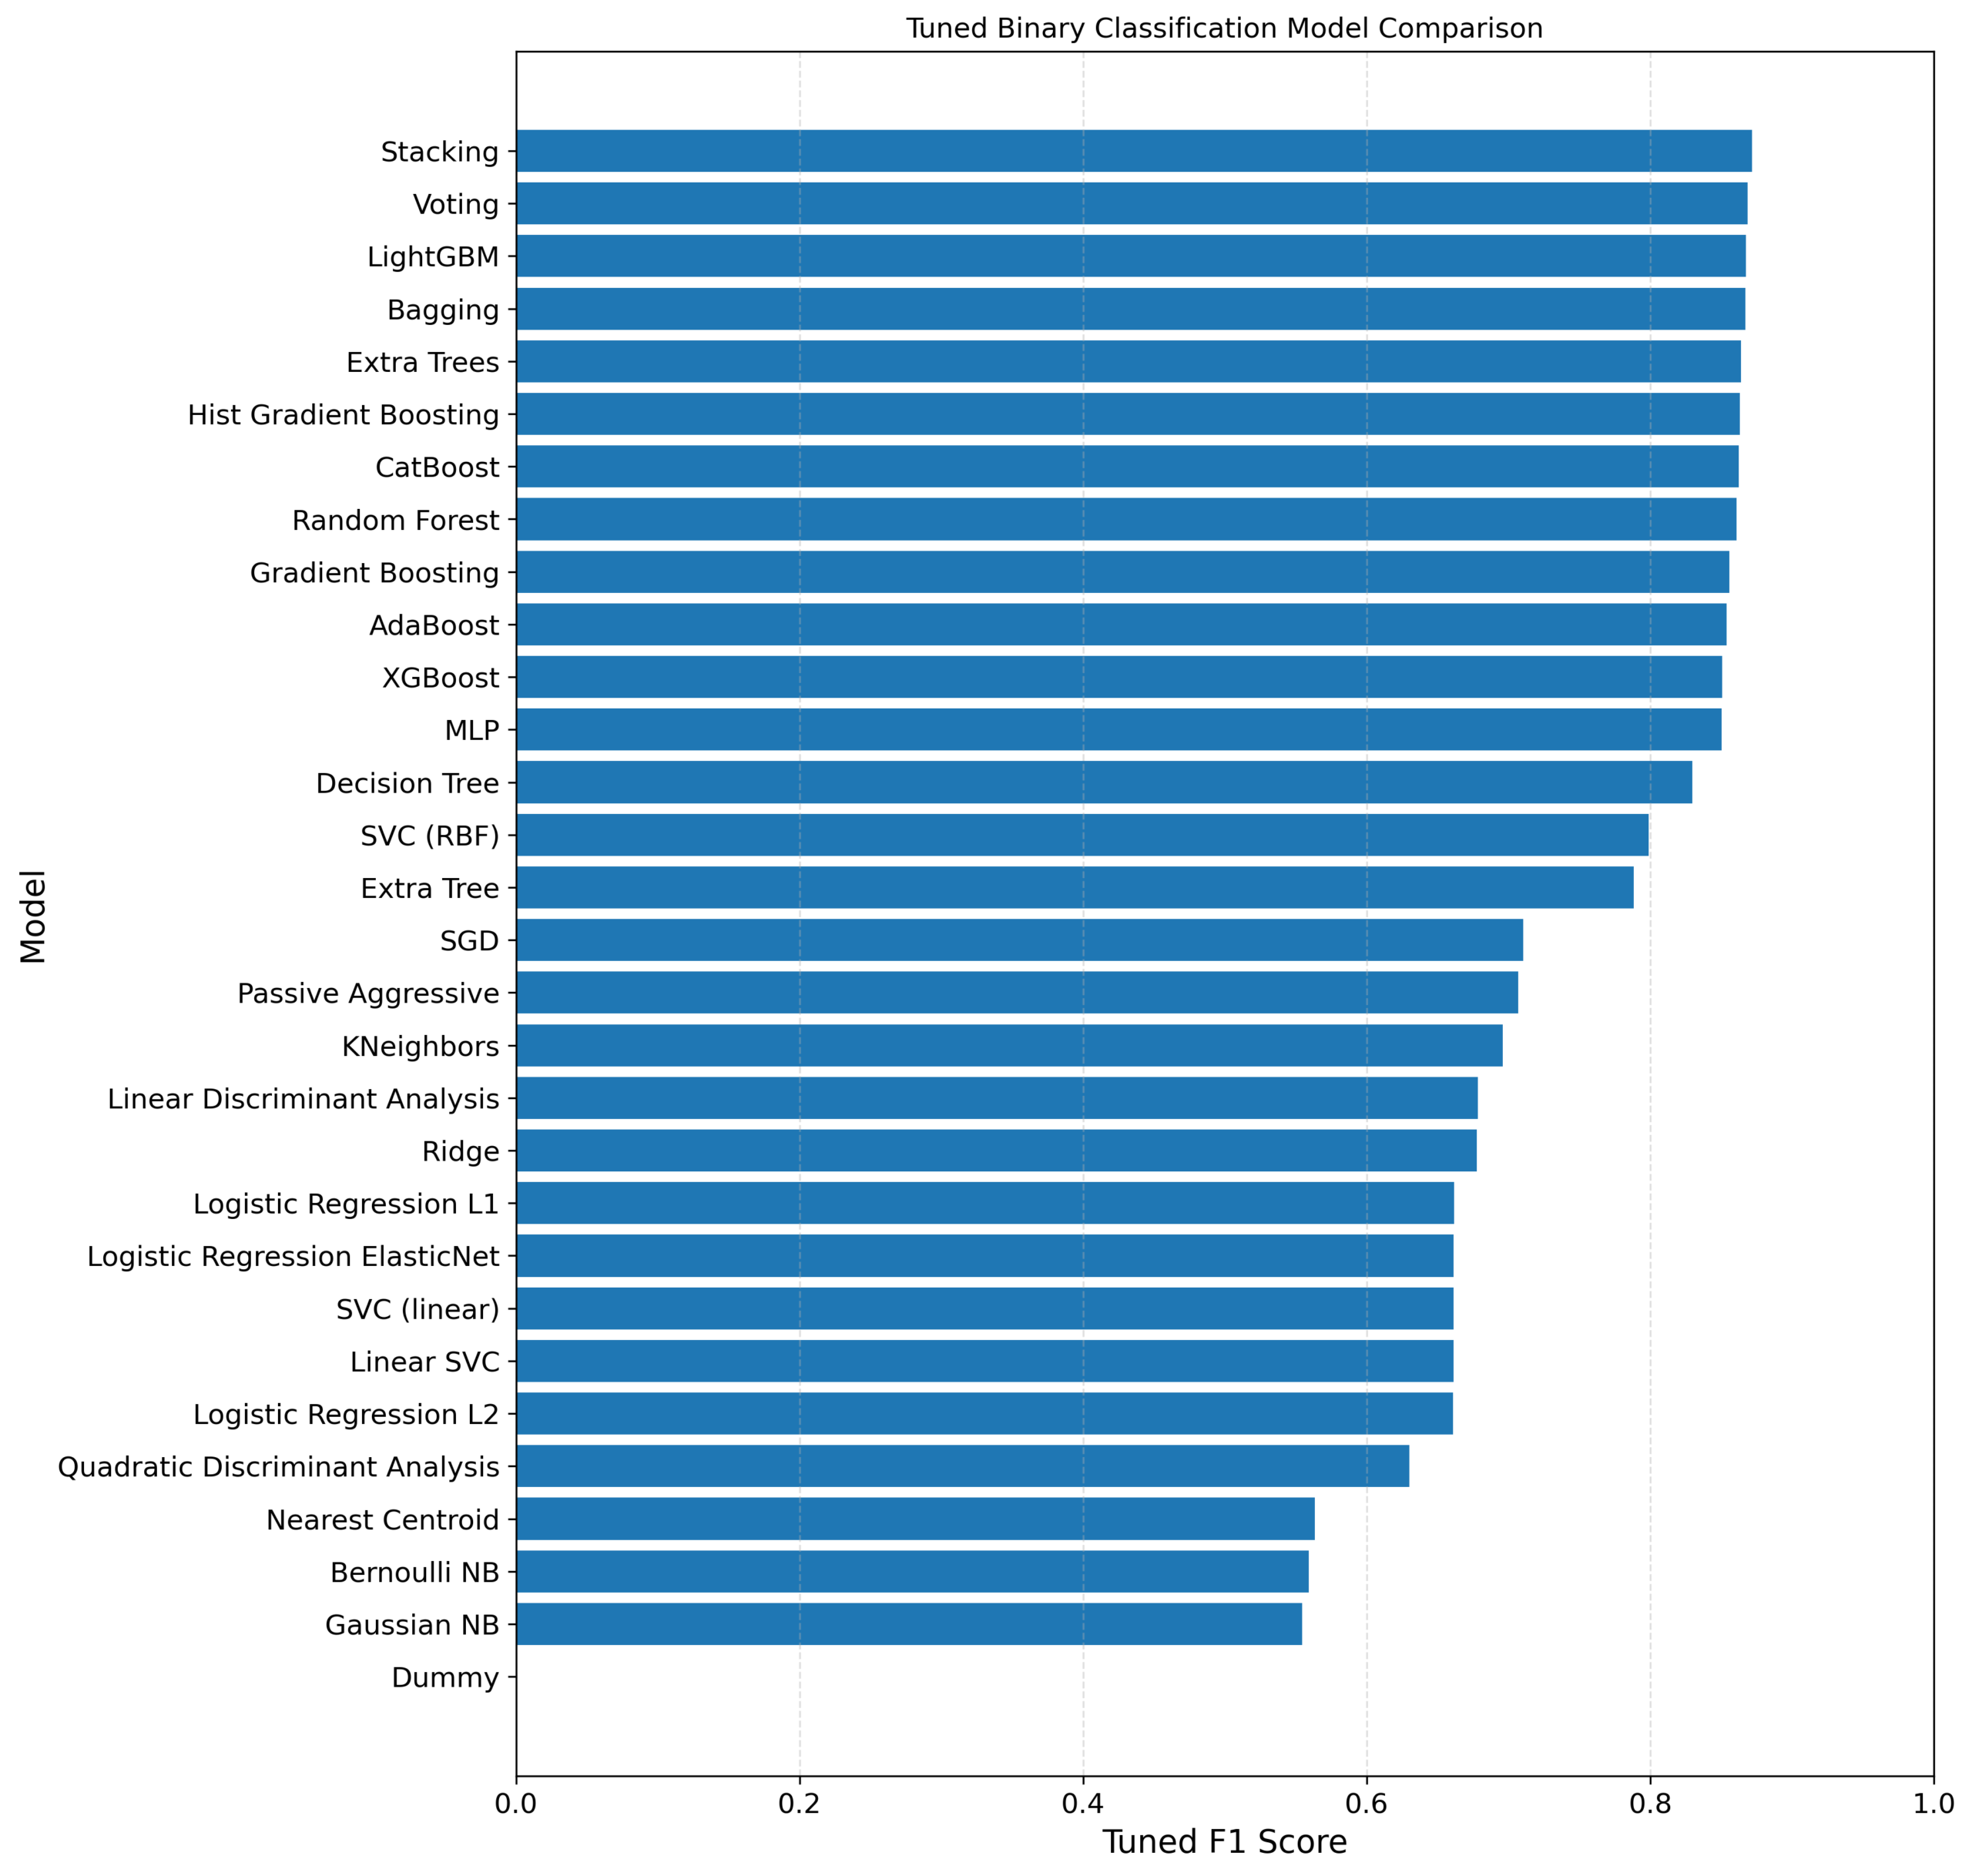
The tuned classification models were compared using multiple evaluation metrics, including accuracy, precision, recall, F1 score and ROC AUC, together with training and prediction runtime. This provides a broader view of model performance than relying on a single metric.

Detailed comparison of training, tuned and final test performance, together with fitting, prediction and total runtime.


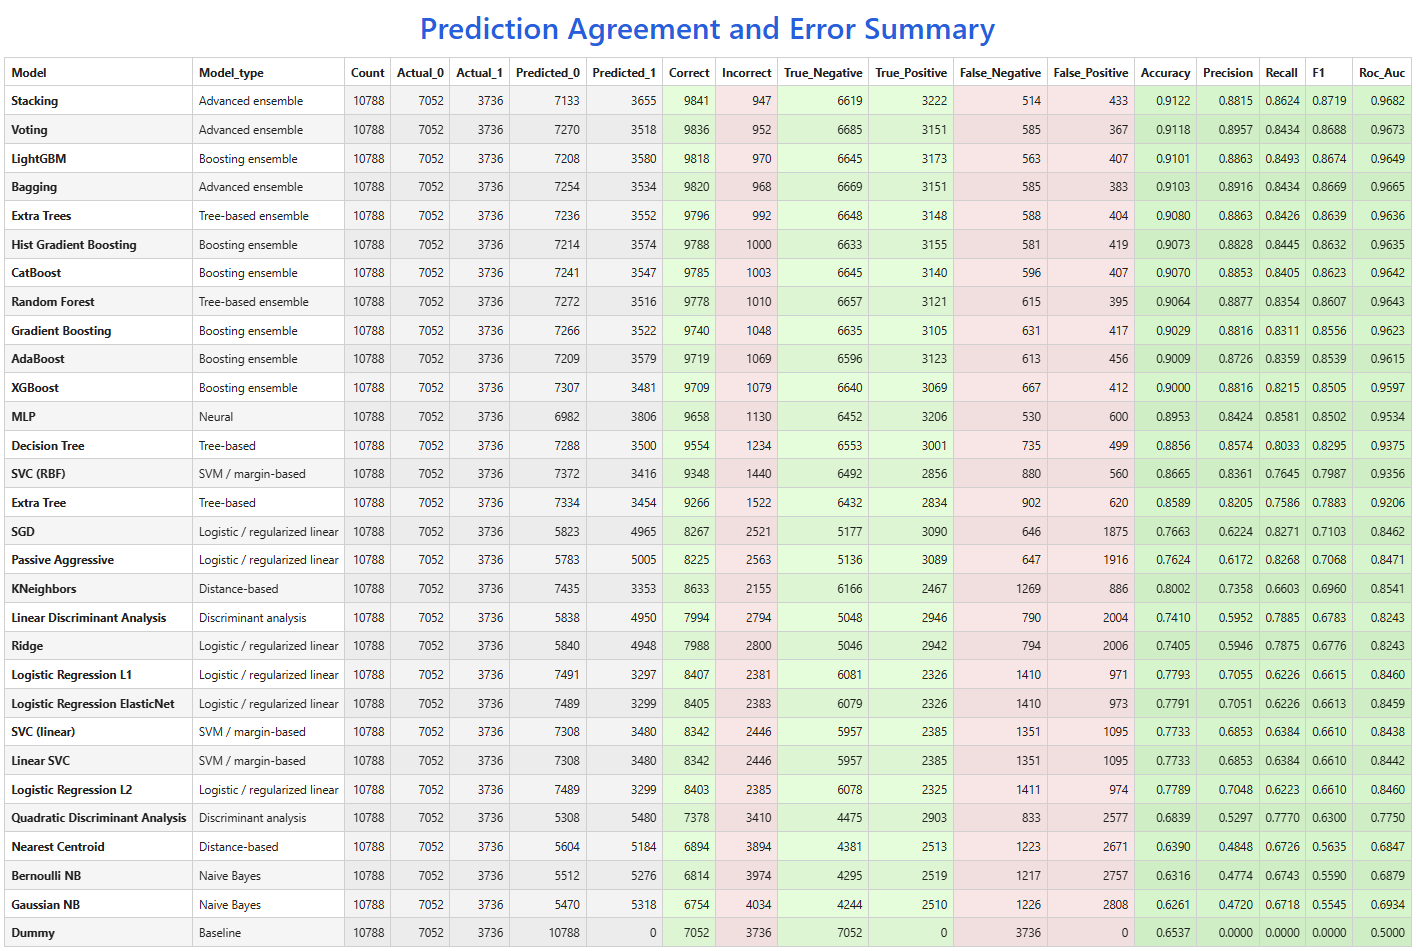
Prediction agreement and error counts were also compared to show how the models differed in correct classifications, false negatives and false positives on the final test set.

Summary of prediction agreement, classification errors and final test metrics across the tuned binary classification models.

Visual Model Comparison

Probability-Based Model Evaluation
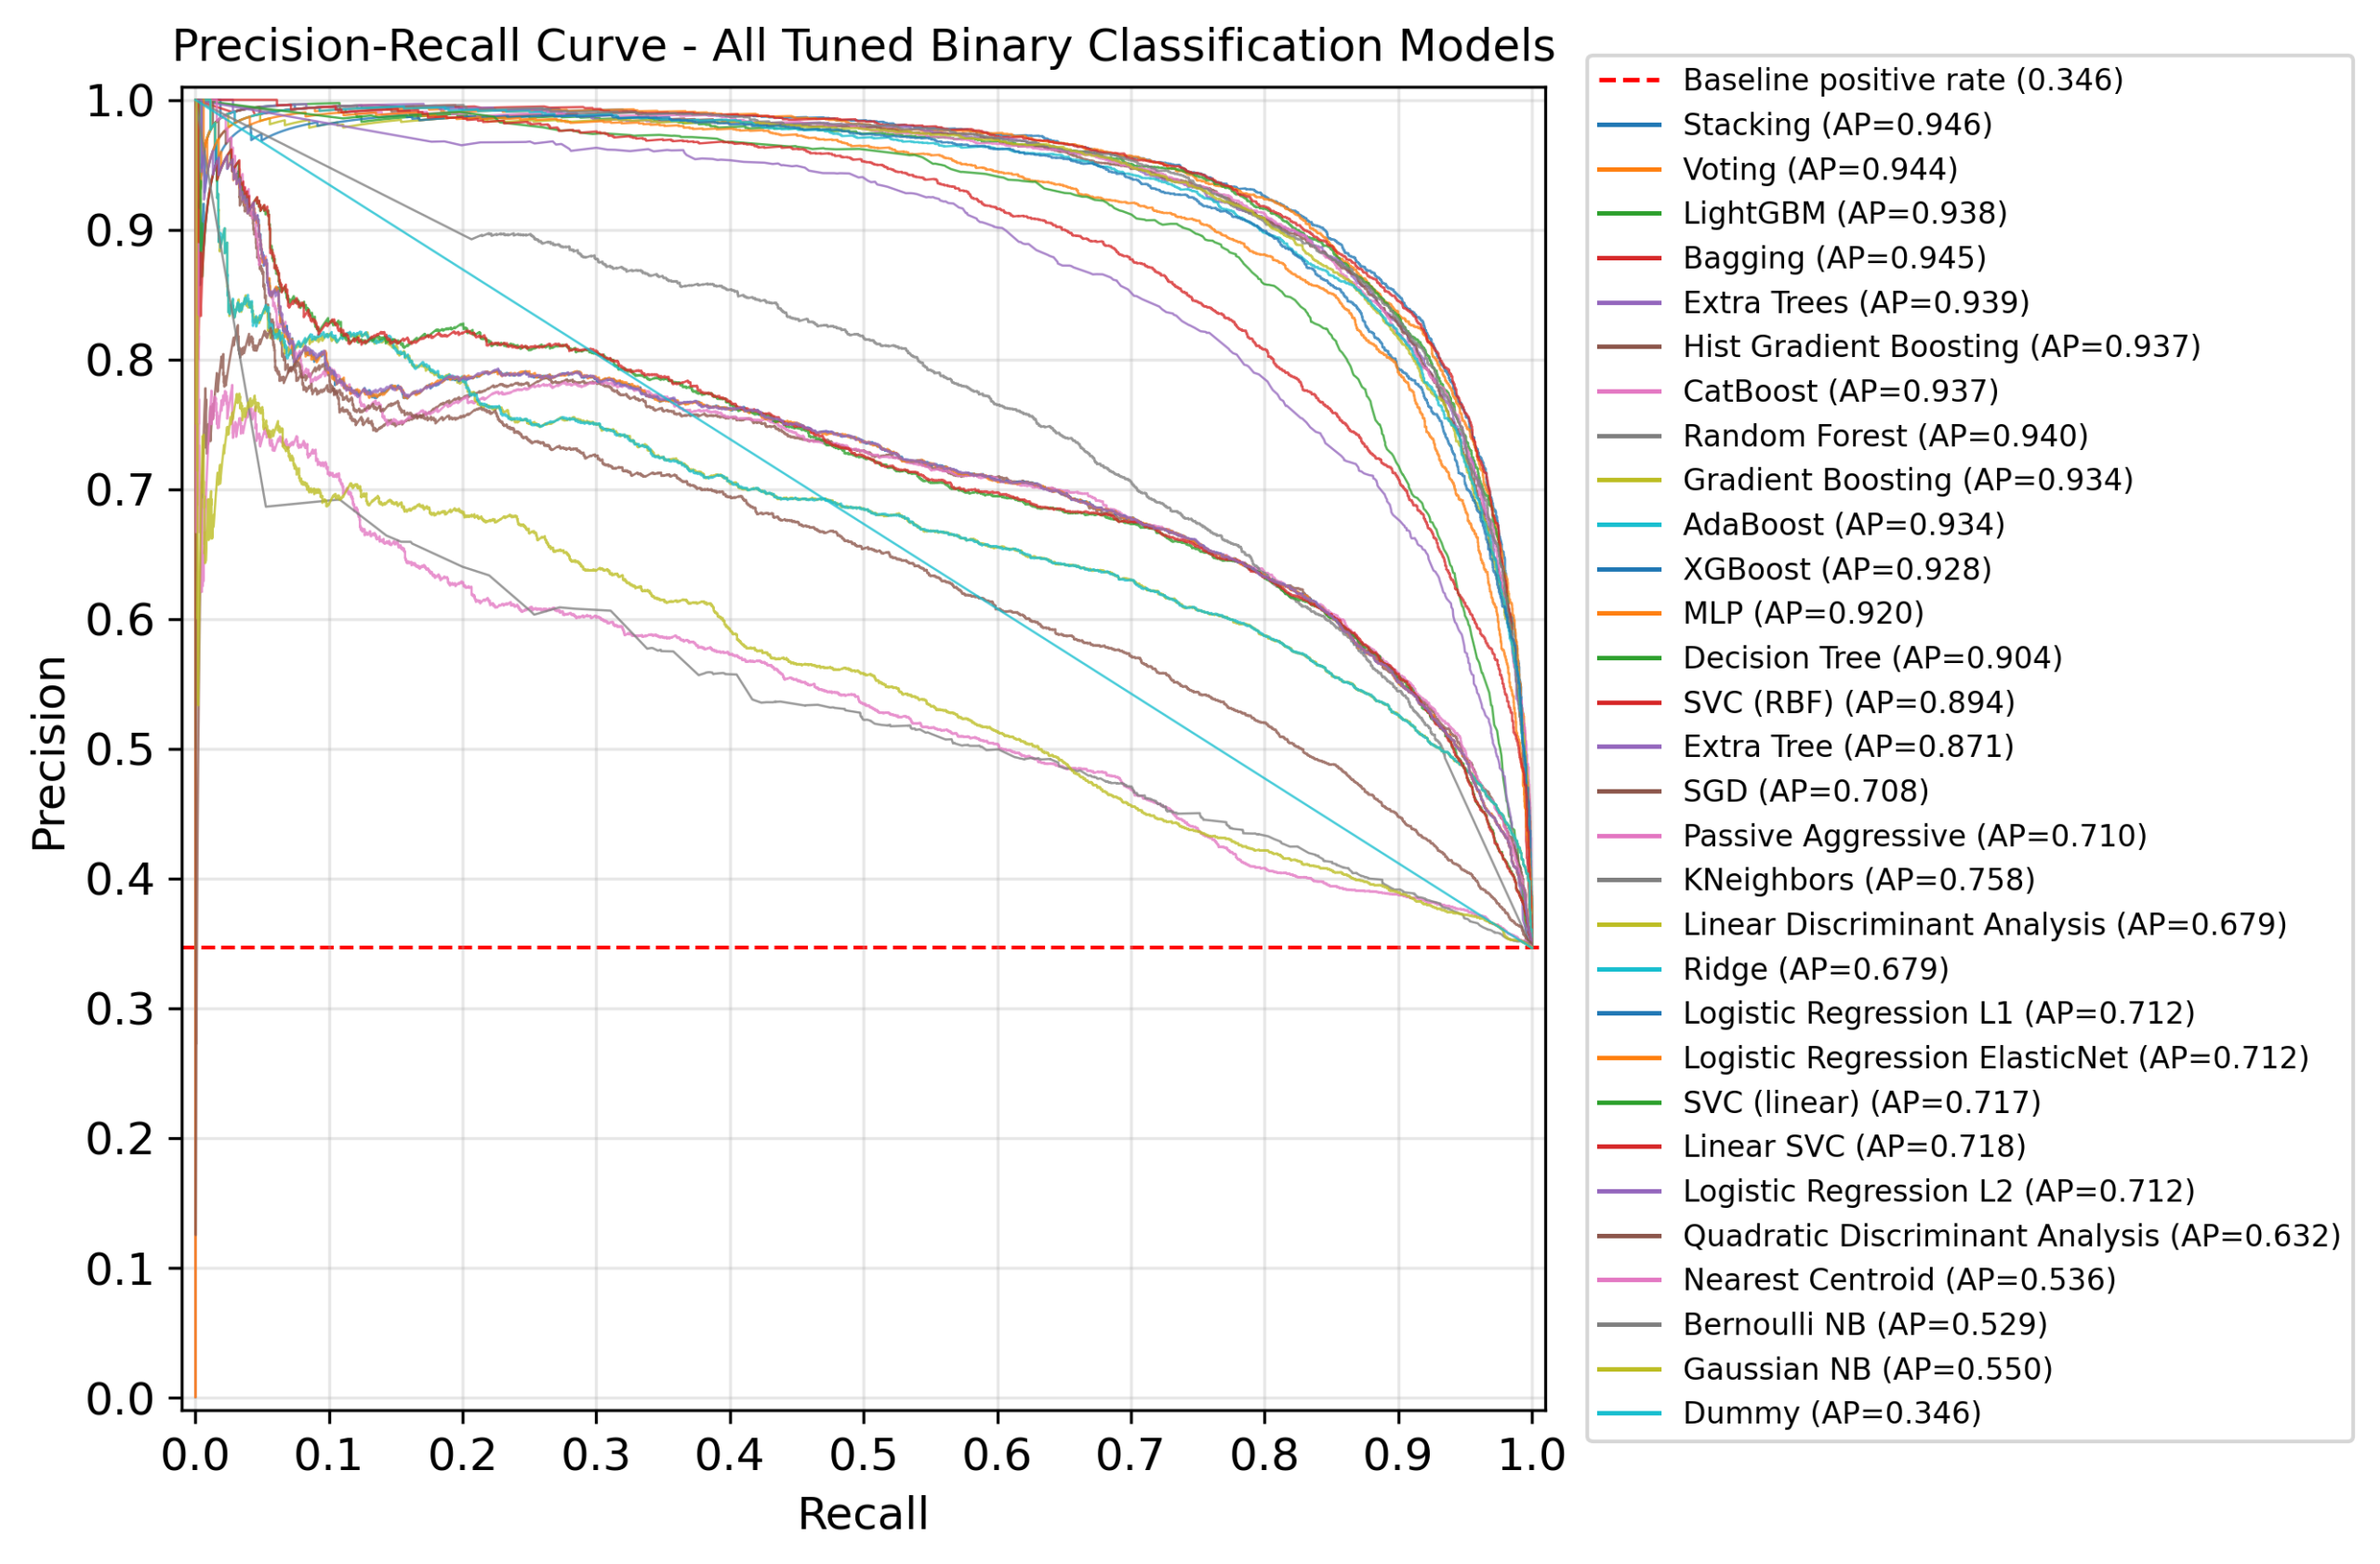
The models were also evaluated using probability-based metrics to examine how well they separate the two classes across different decision thresholds. Precision-recall analysis is particularly useful for understanding the trade-off between identifying positive cases and avoiding false positive predictions.

Precision-recall curves for all tuned binary classification models, showing the trade-off between precision and recall across different decision thresholds.


ROC Curve Analysis

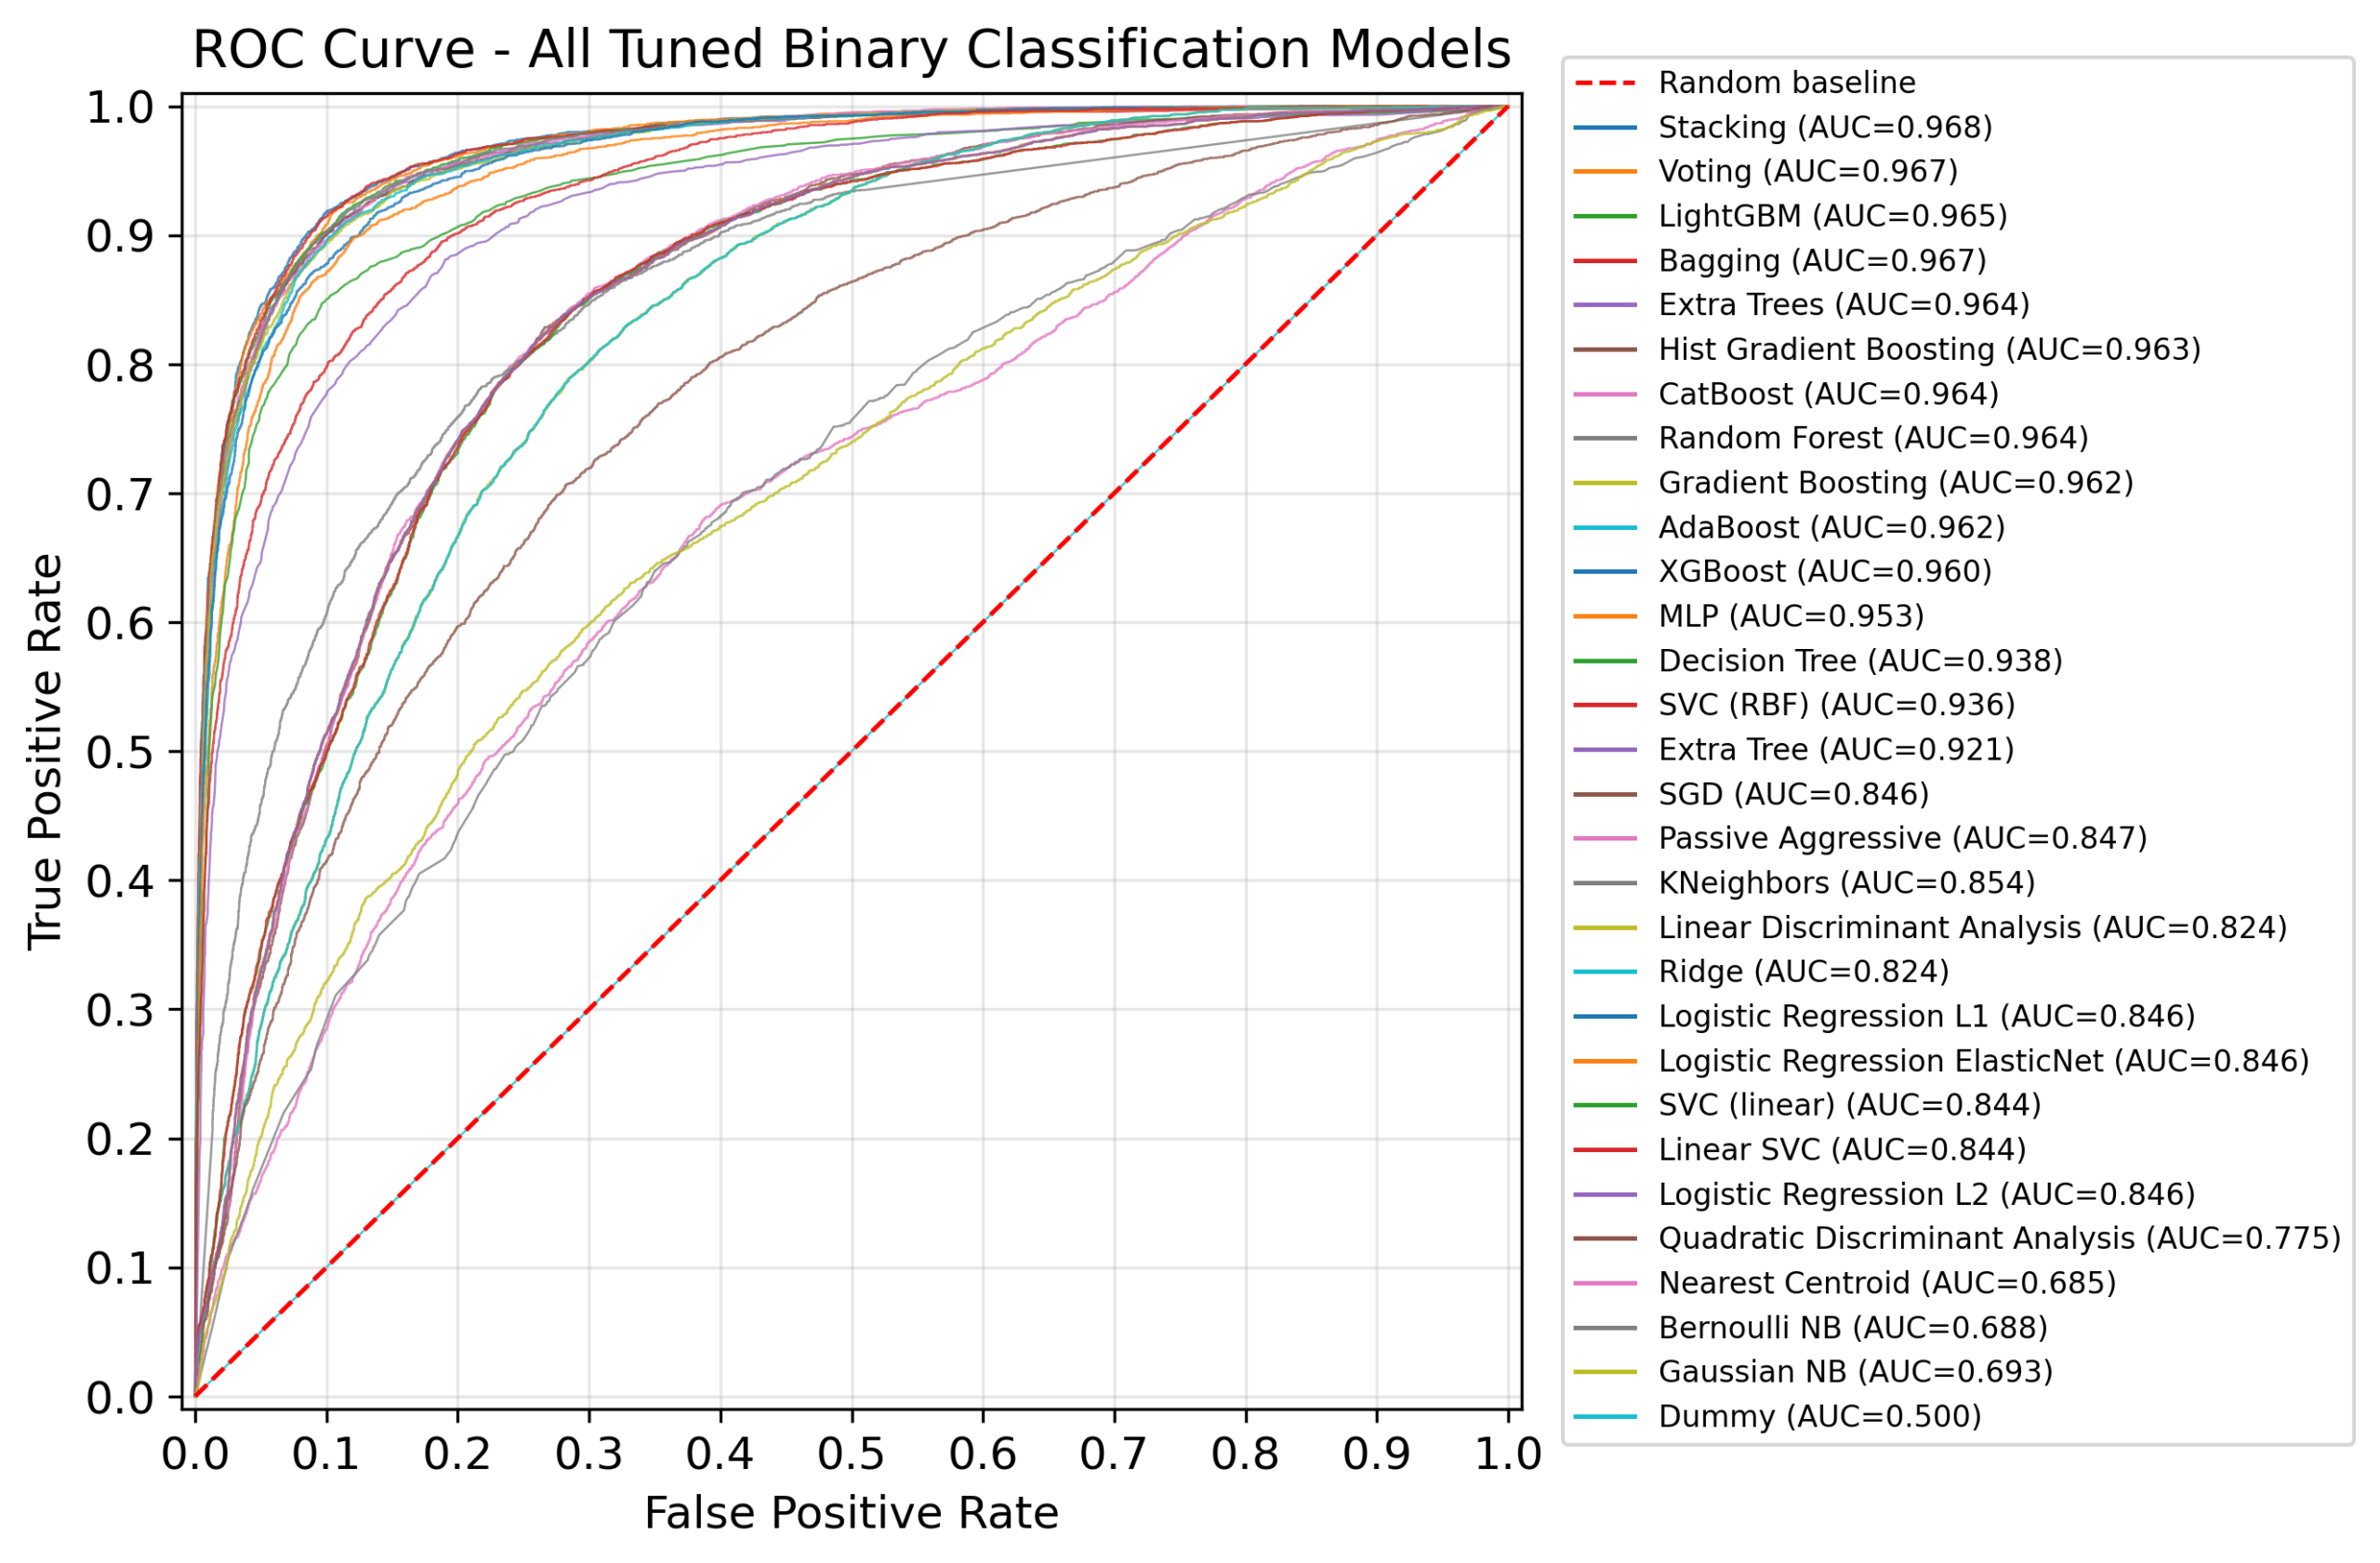
ROC analysis was used to compare how effectively the tuned classification models distinguish between the two classes across different classification thresholds. The curves provide another probability-based perspective on model discrimination and overall classification performance.

ROC curves for all tuned binary classification models, showing their ability to distinguish between the two target classes across different decision thresholds.


Classification Error Analysis

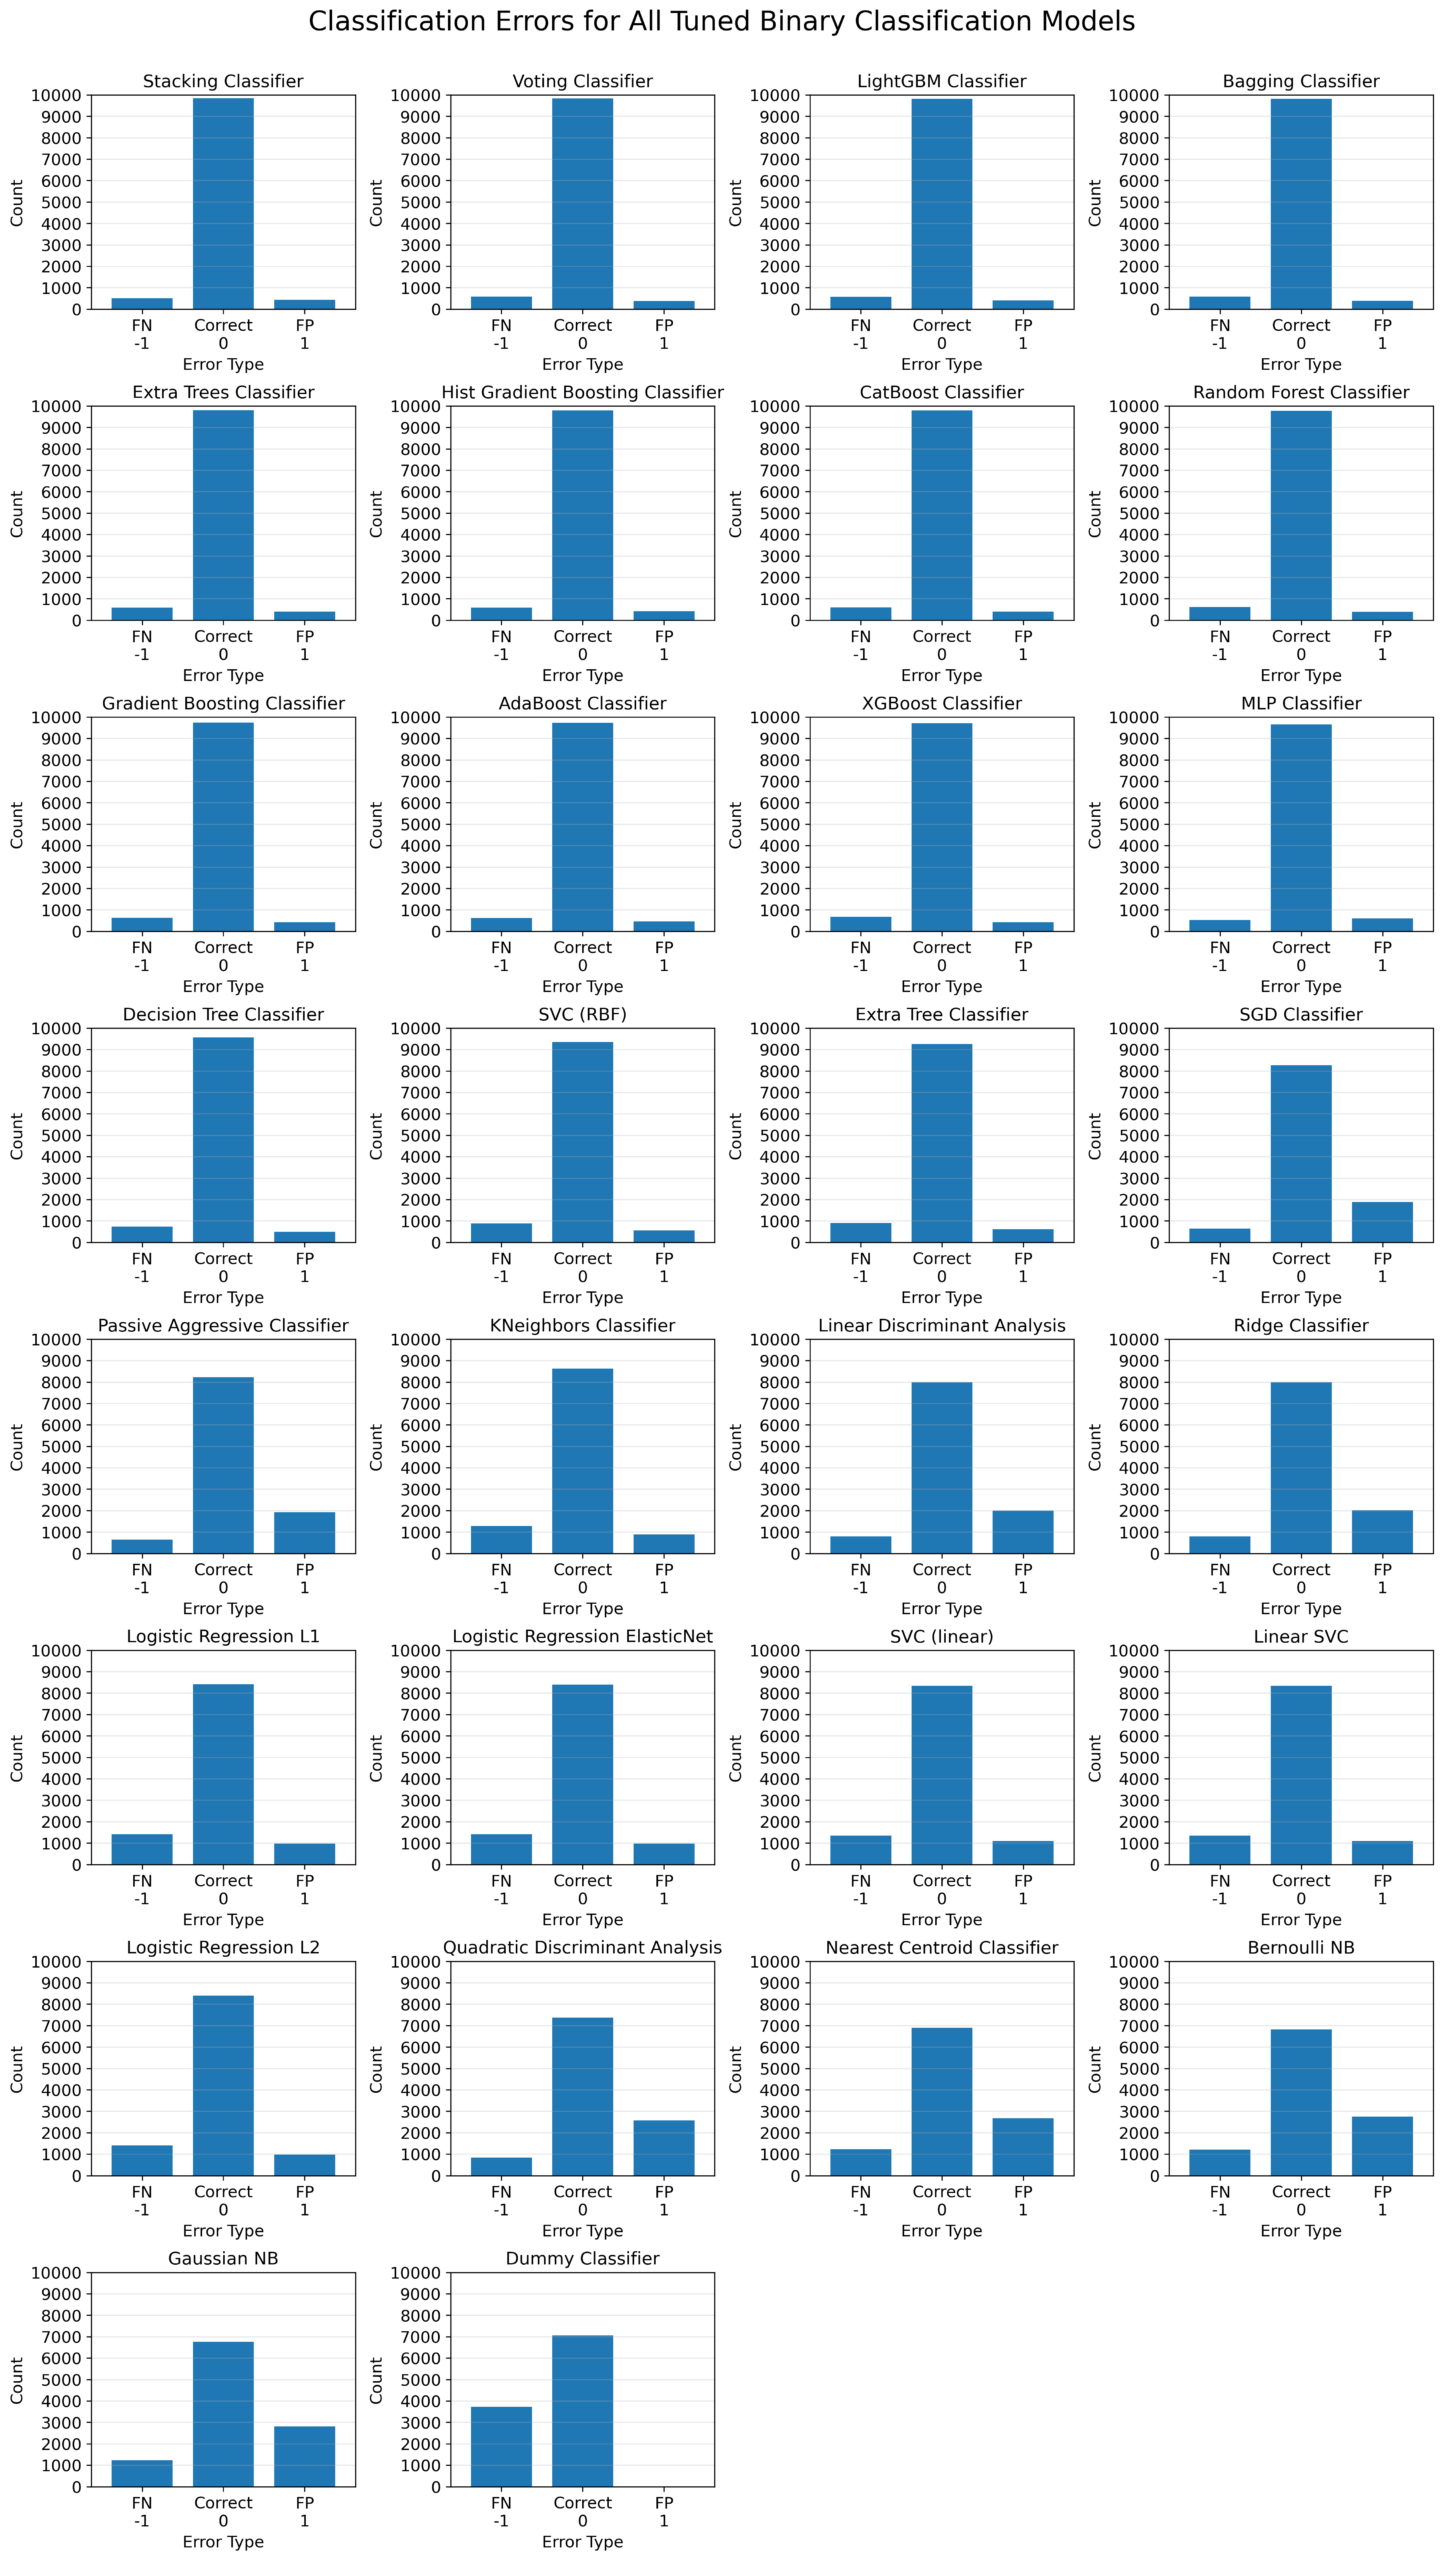
Classification errors were analysed across the tuned models to examine how frequently each classifier produced incorrect predictions and how those errors differed between false positive and false negative cases.

Comparison of classification errors across all tuned binary classification models, including false positive and false negative predictions.


Confusion Matrix Analysis

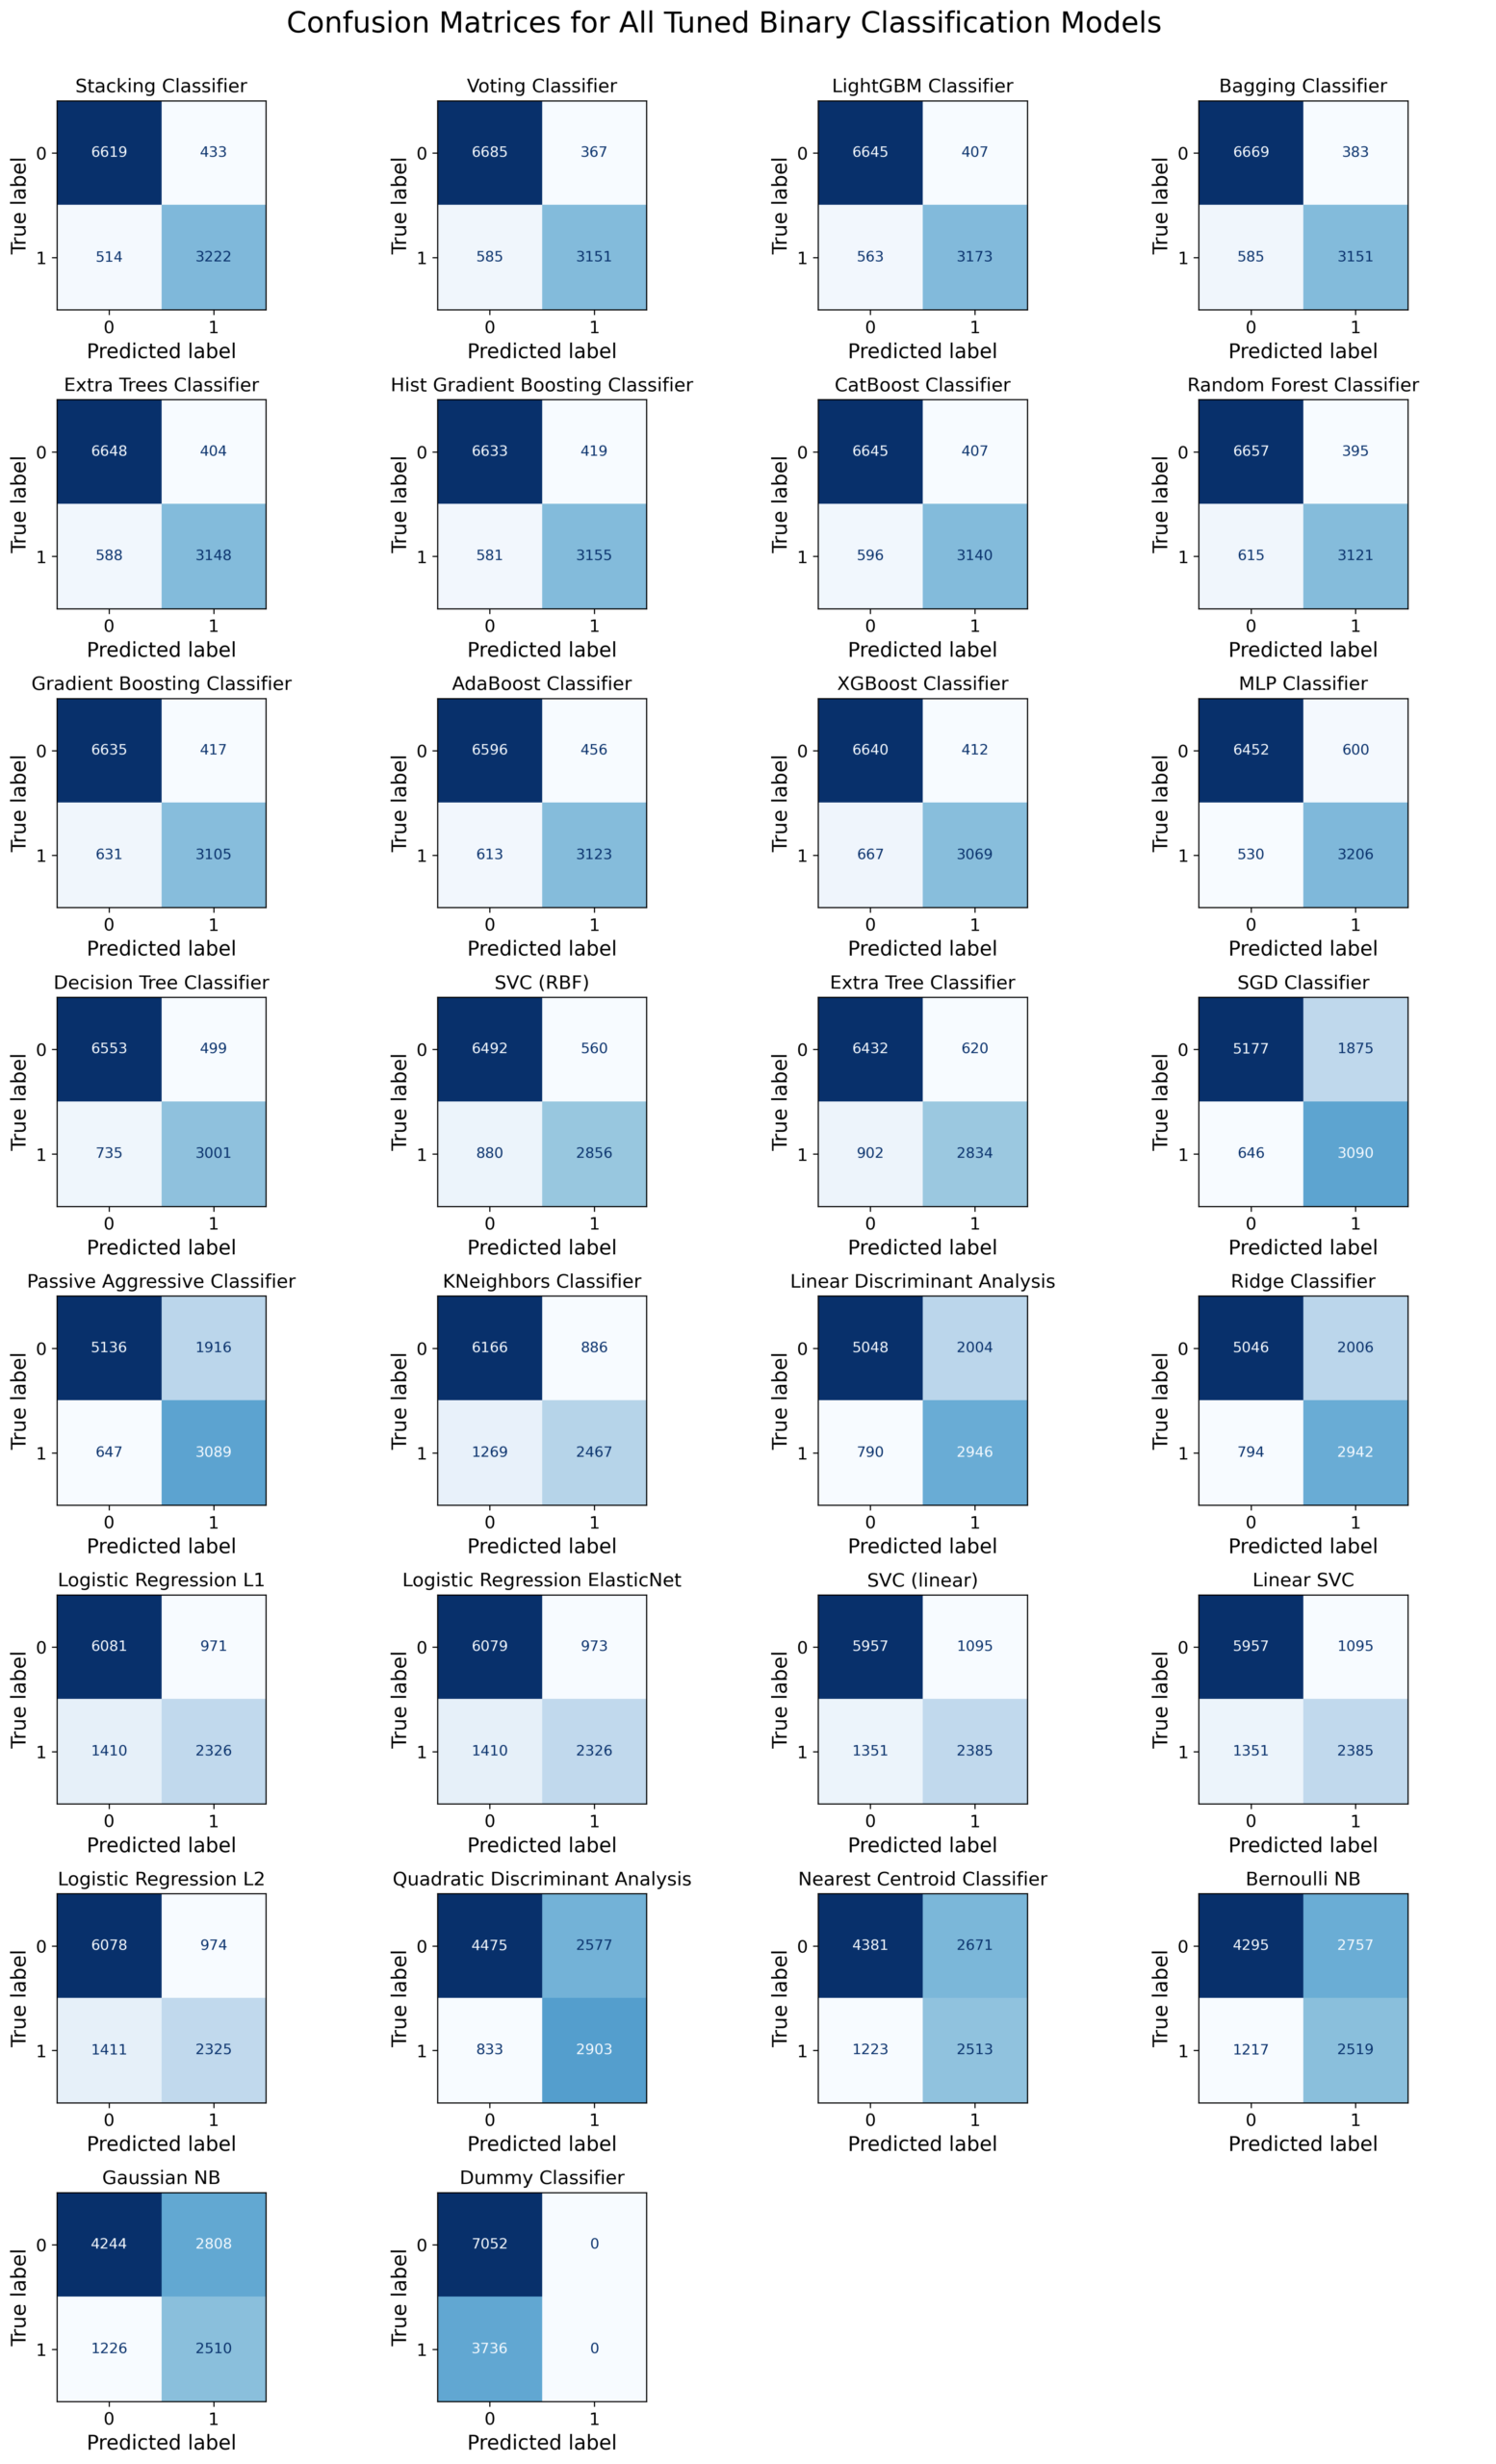
Confusion matrices were used to examine the distribution of correct and incorrect predictions for each tuned classifier. This provides a more detailed view of classification behaviour than a single summary metric.

Confusion matrices for all tuned binary classification models, showing the distribution of true positive, true negative, false positive and false negative predictions.


Prediction Behaviour Analysis

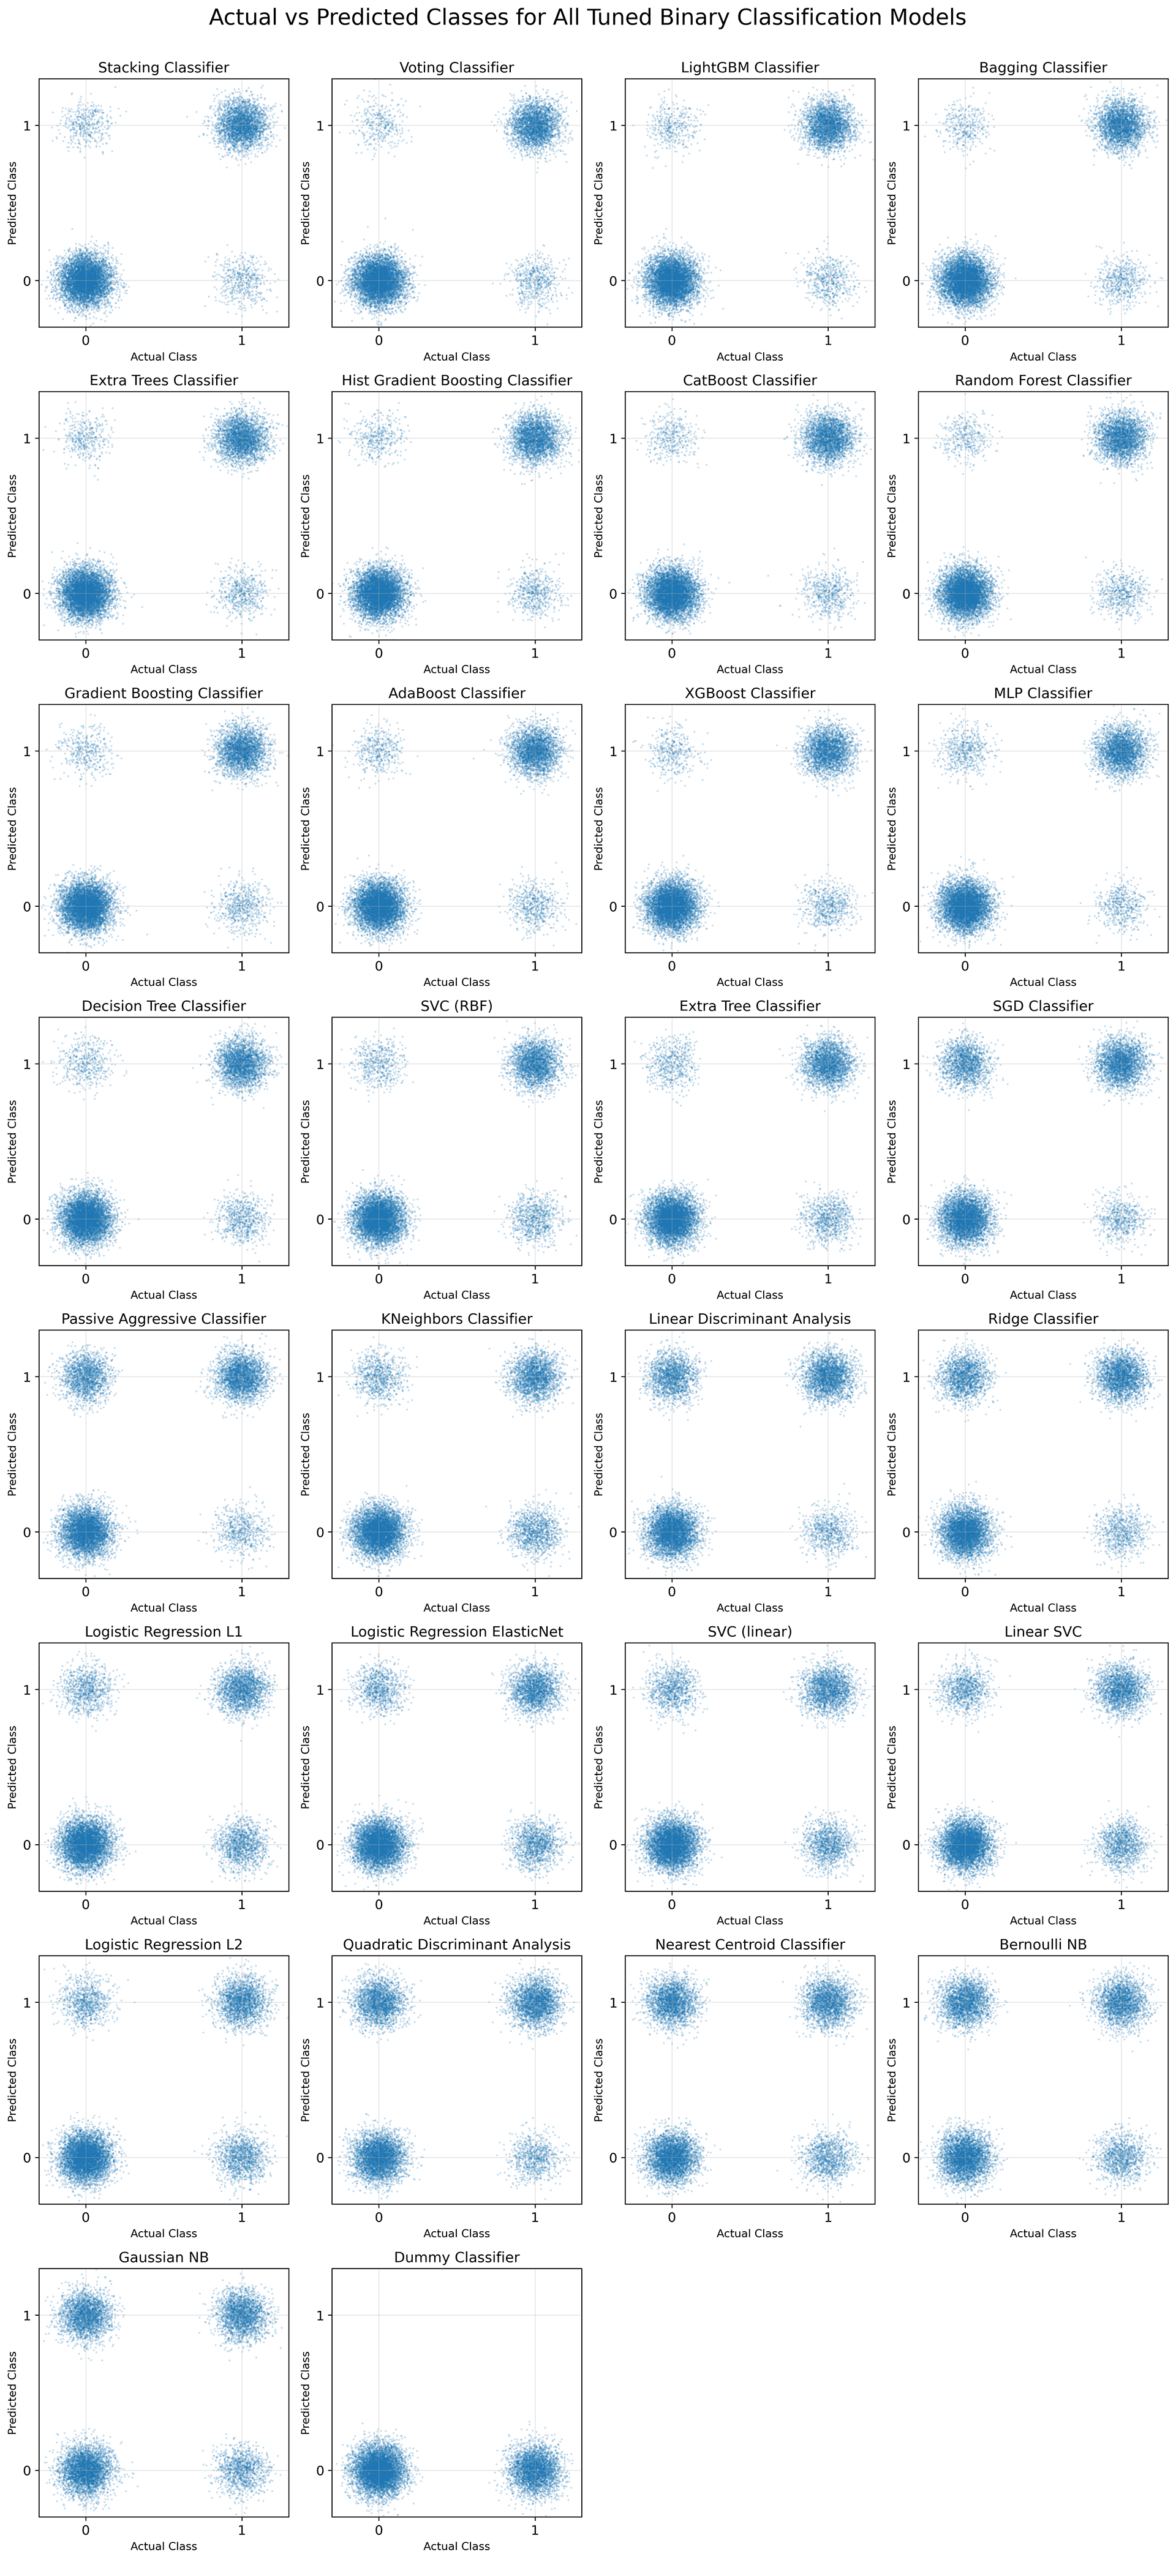
Actual and predicted class labels were compared across the tuned models to examine how consistently each classifier reproduced the true target classes and where disagreements occurred.

Actual versus predicted class labels for all tuned binary classification models, showing agreement and disagreement with the true target classes.

Best Model Analysis: Stacking Classifier
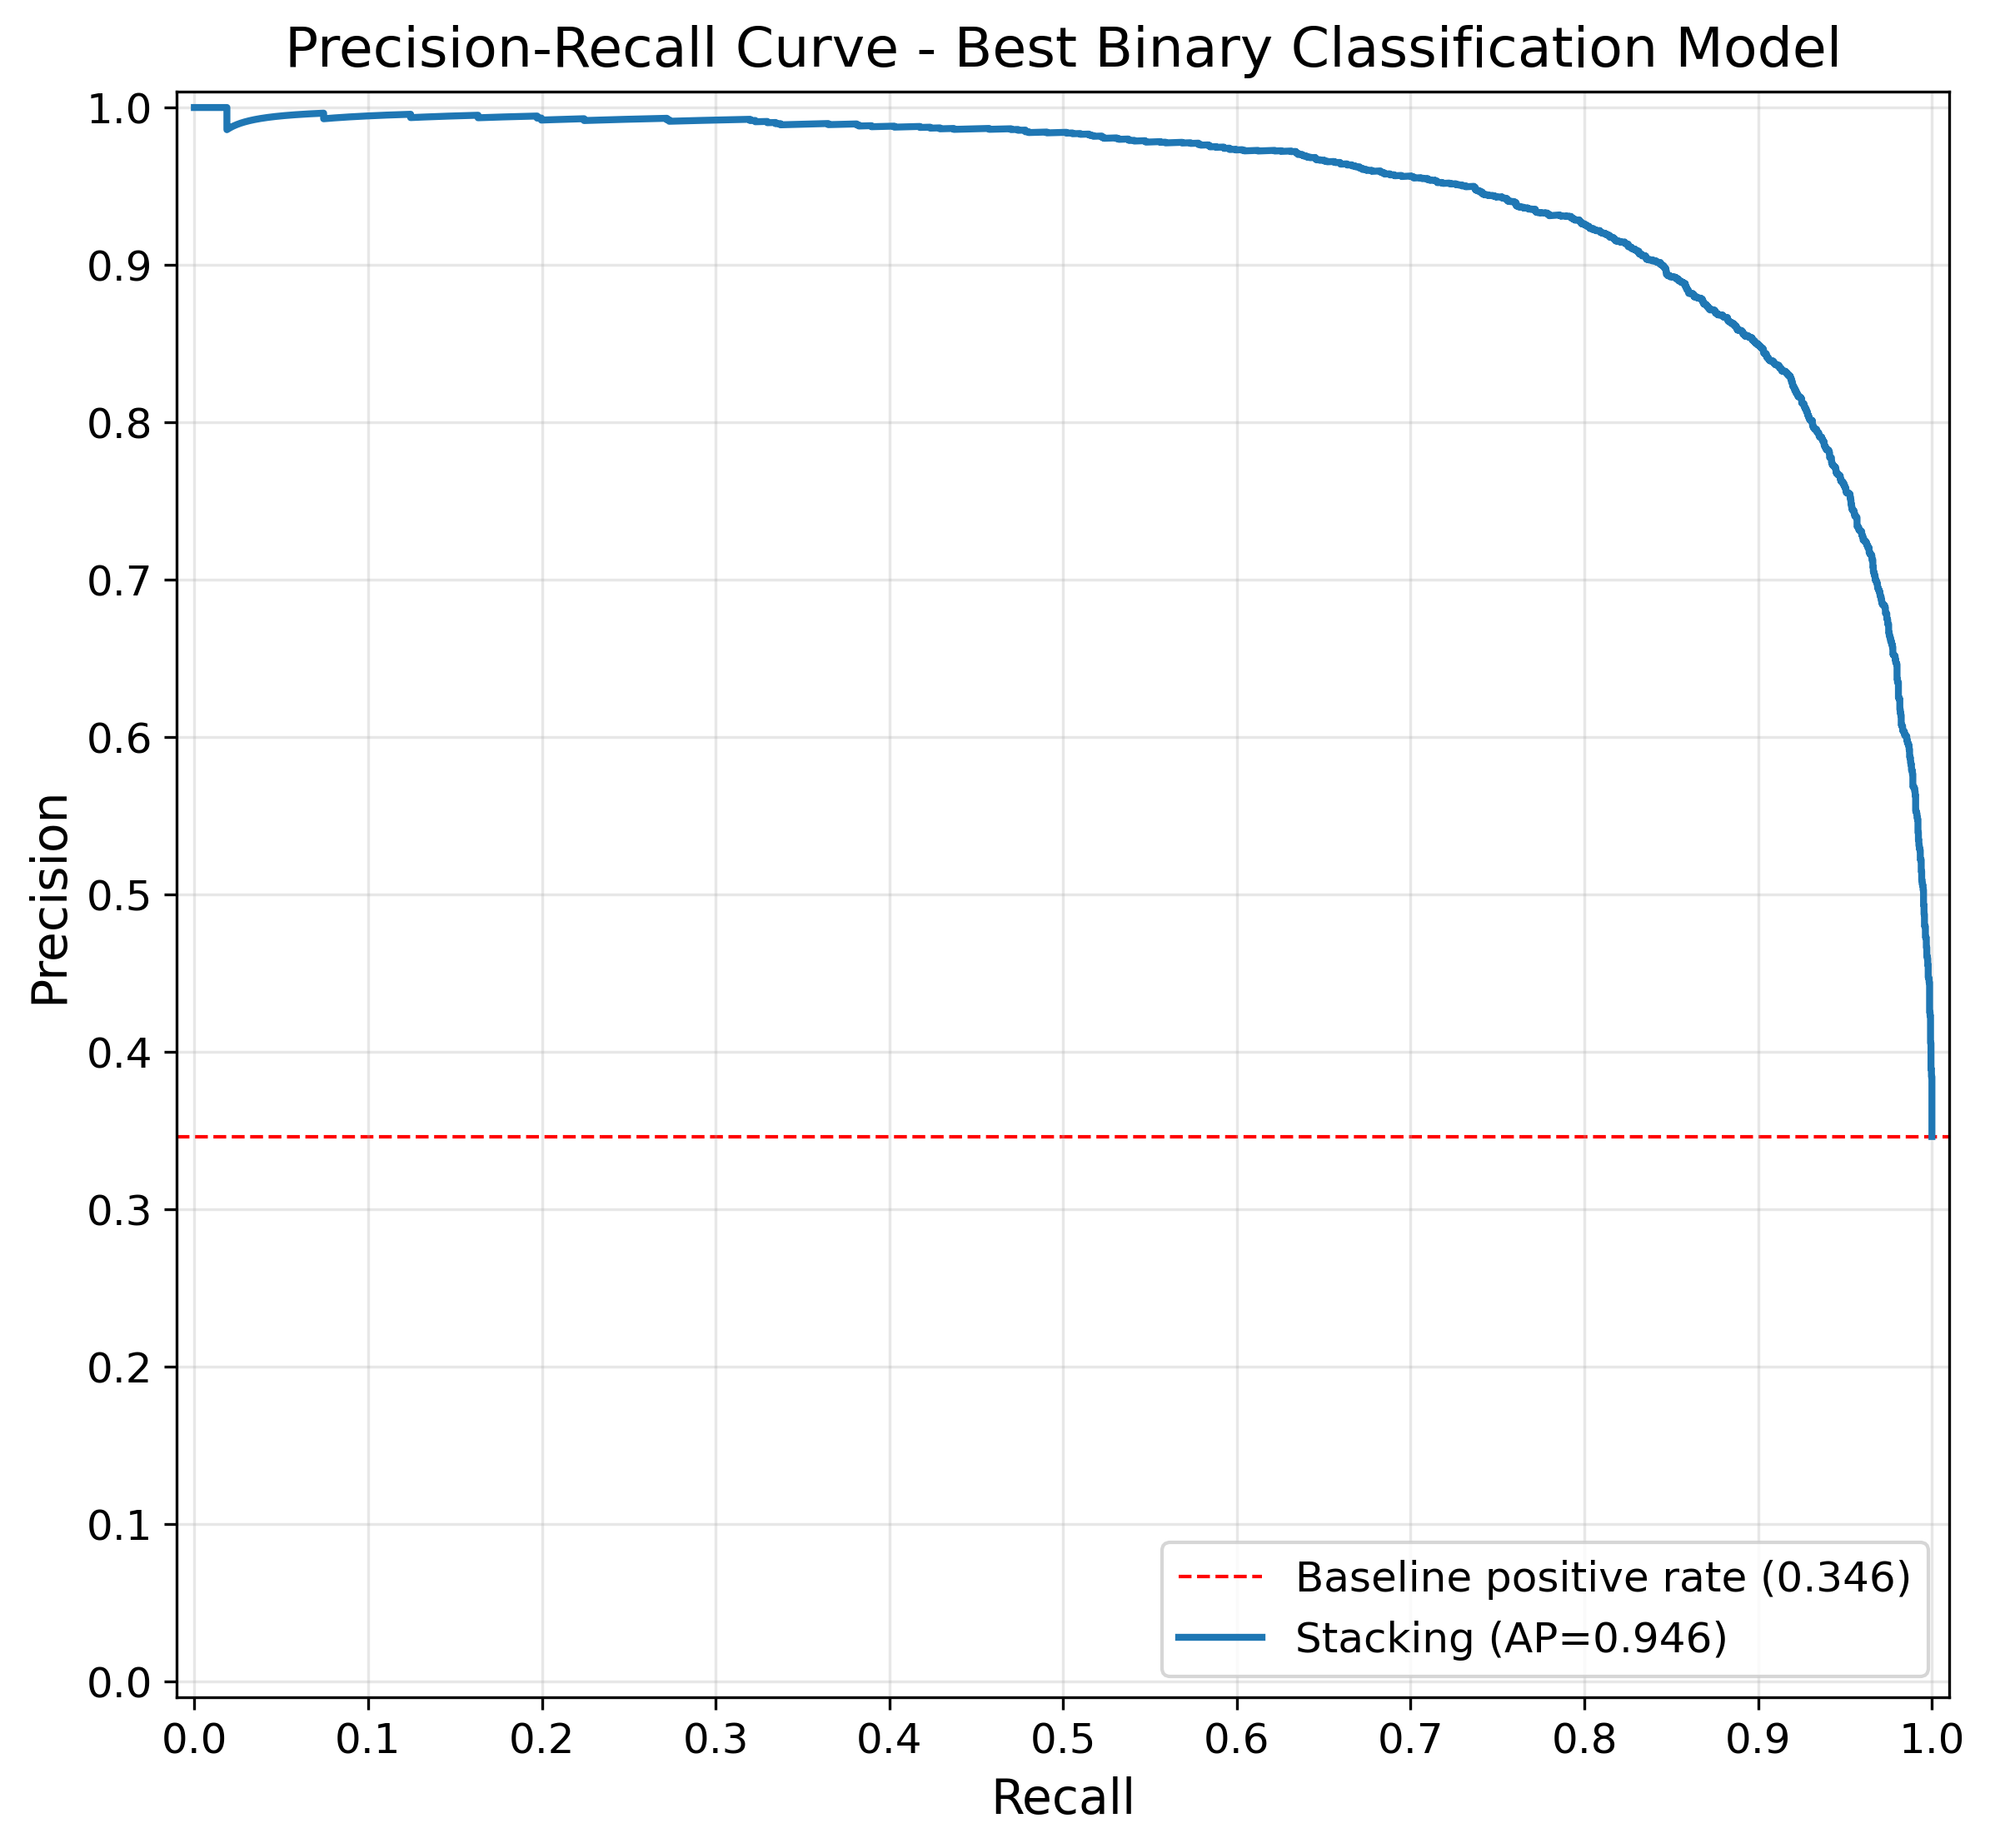
The best-performing model was examined separately to show its precision-recall behaviour more clearly and to provide a focused view of the trade-off between precision and recall.

Precision-recall curve for the best-performing binary classification model, showing its precision-recall trade-off across decision thresholds.


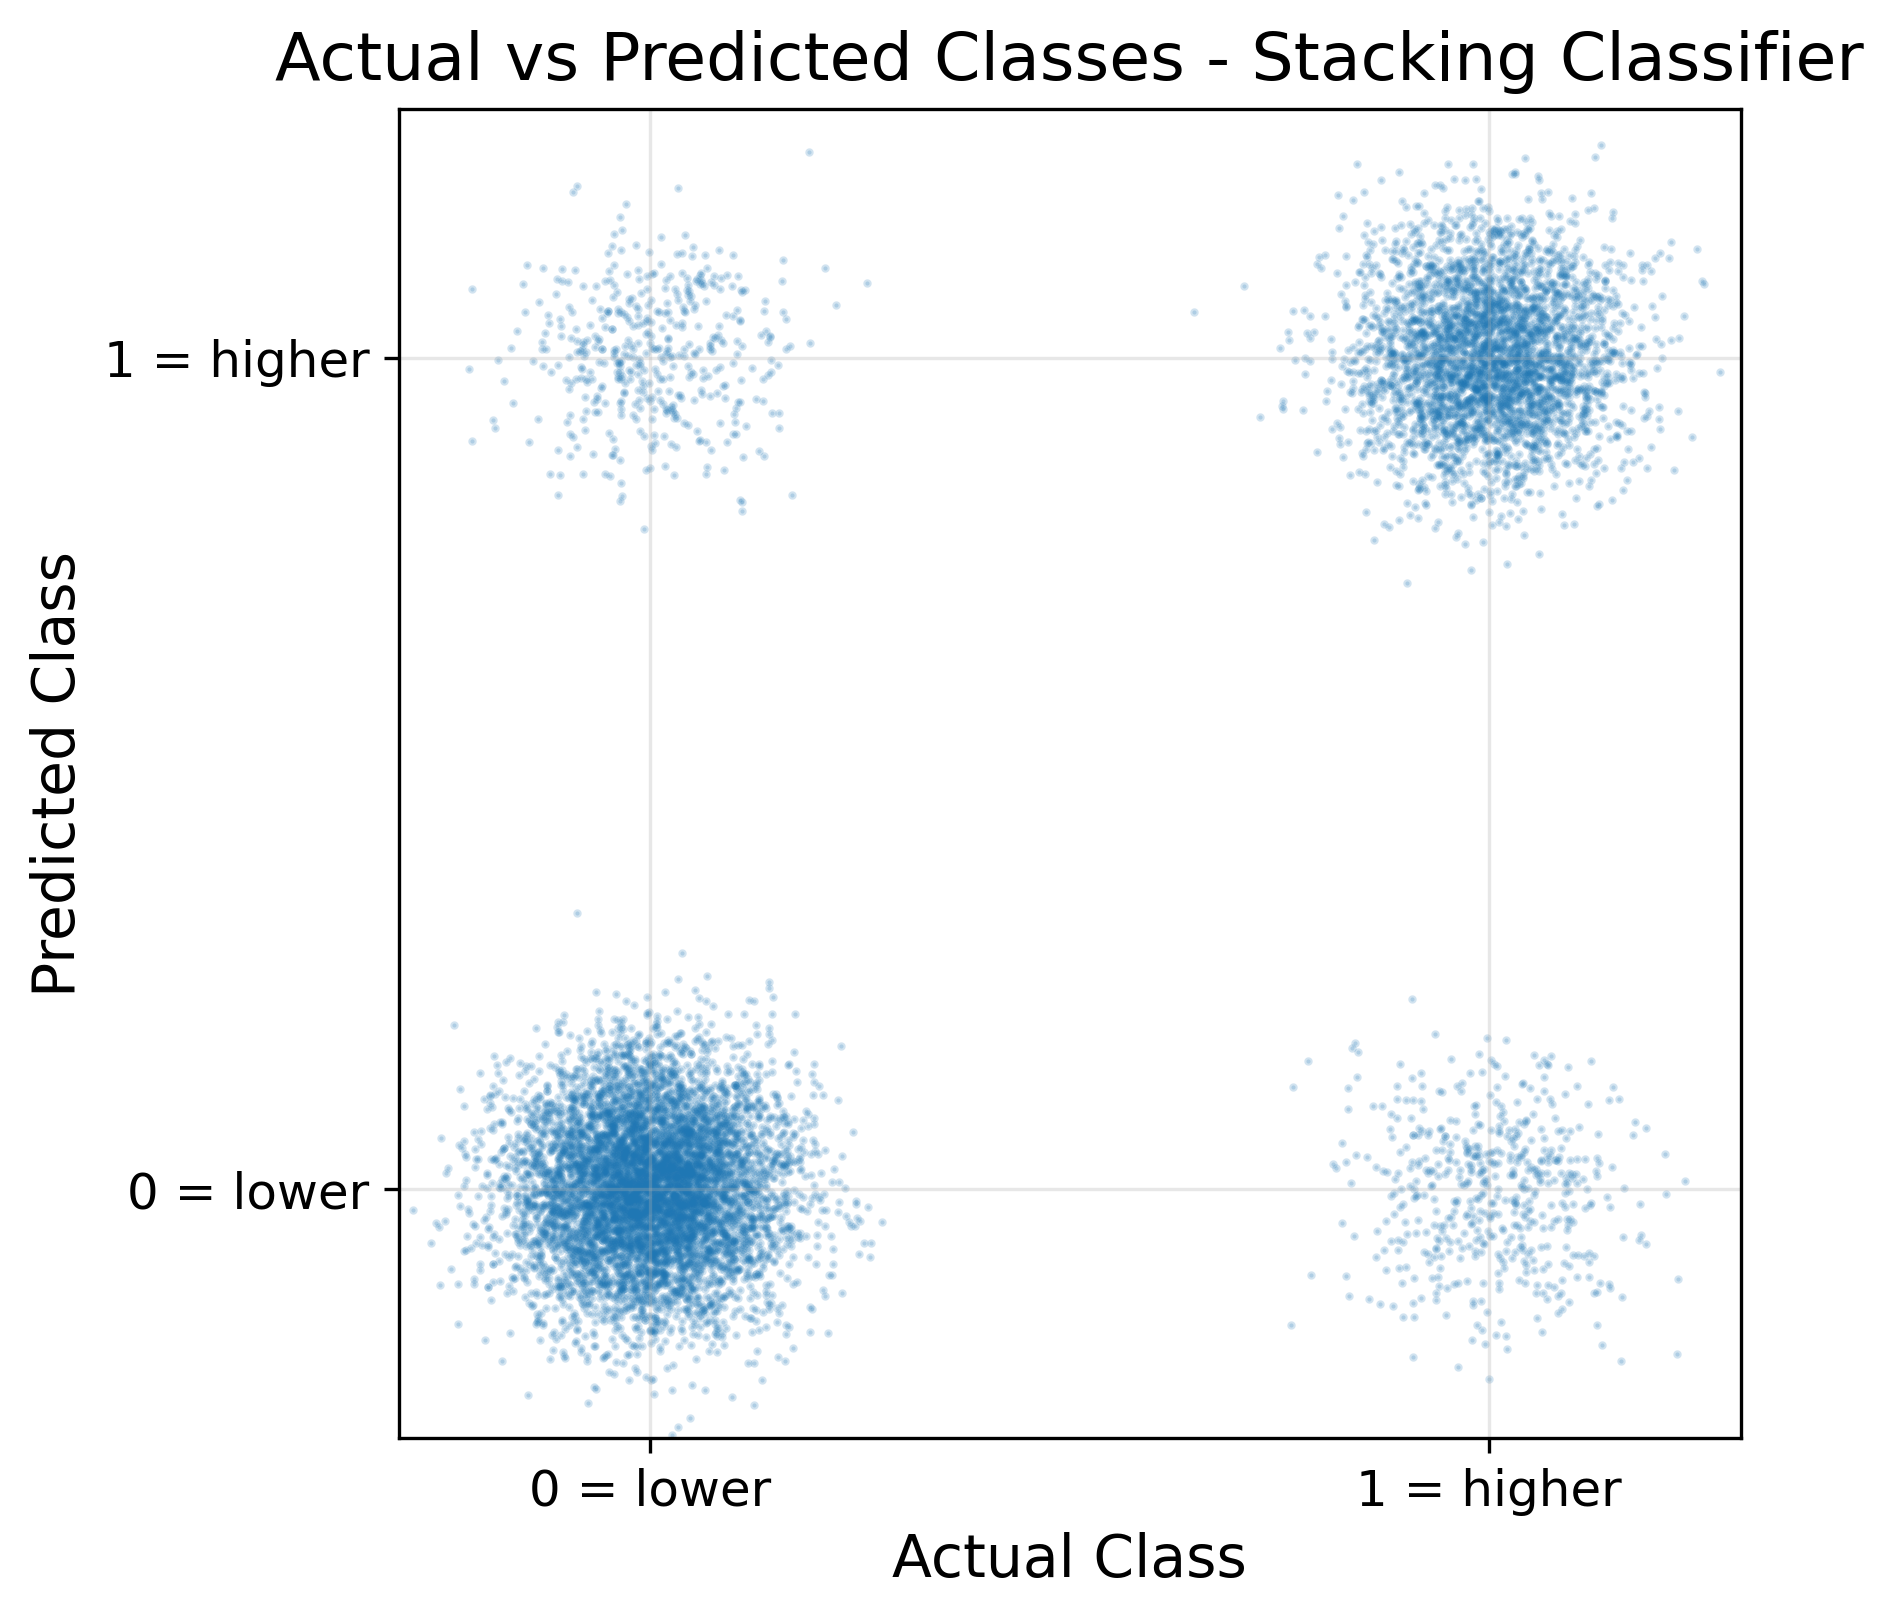
The Stacking Classifier was also examined separately to provide a clearer view of how its predicted class labels compare with the actual target values.

Actual versus predicted class labels for the Stacking Classifier, showing where predictions agree with the true target classes.

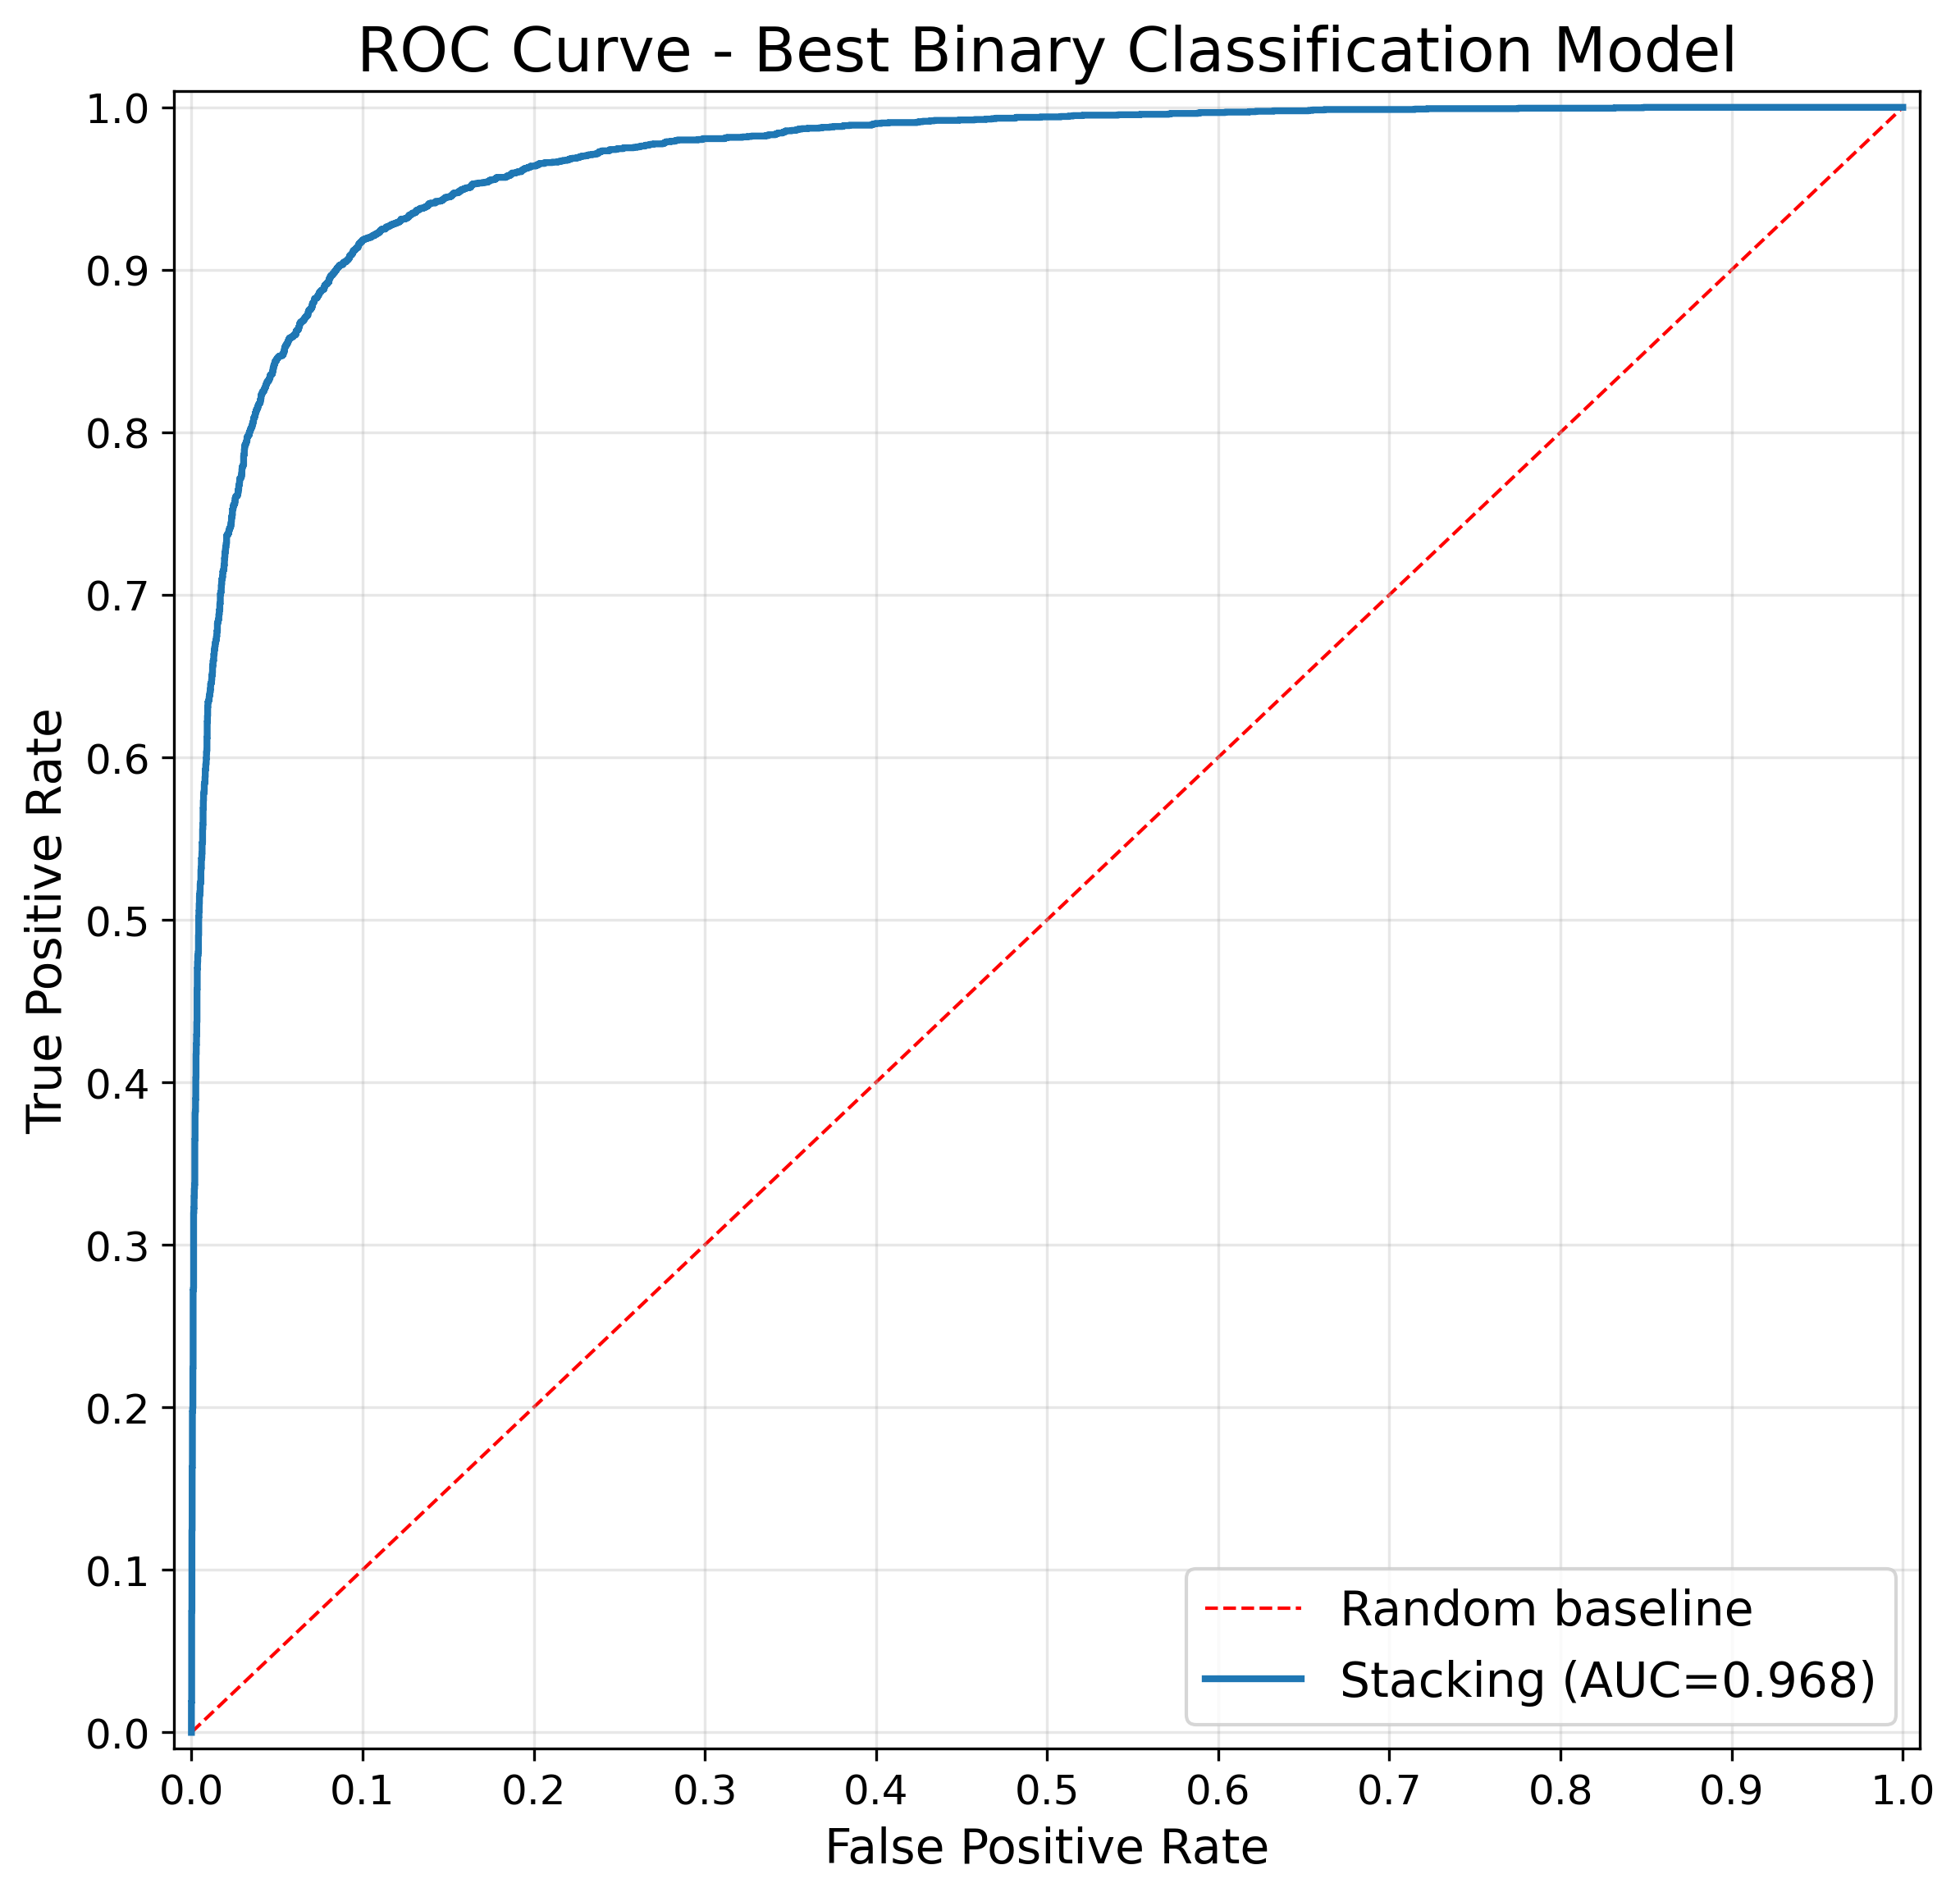
The best-performing classifier was also analysed separately to provide a clearer view of its ROC behaviour and overall class-separation capability.

ROC curve for the best-performing binary classification model, showing its ability to separate the two classes across different classification thresholds.


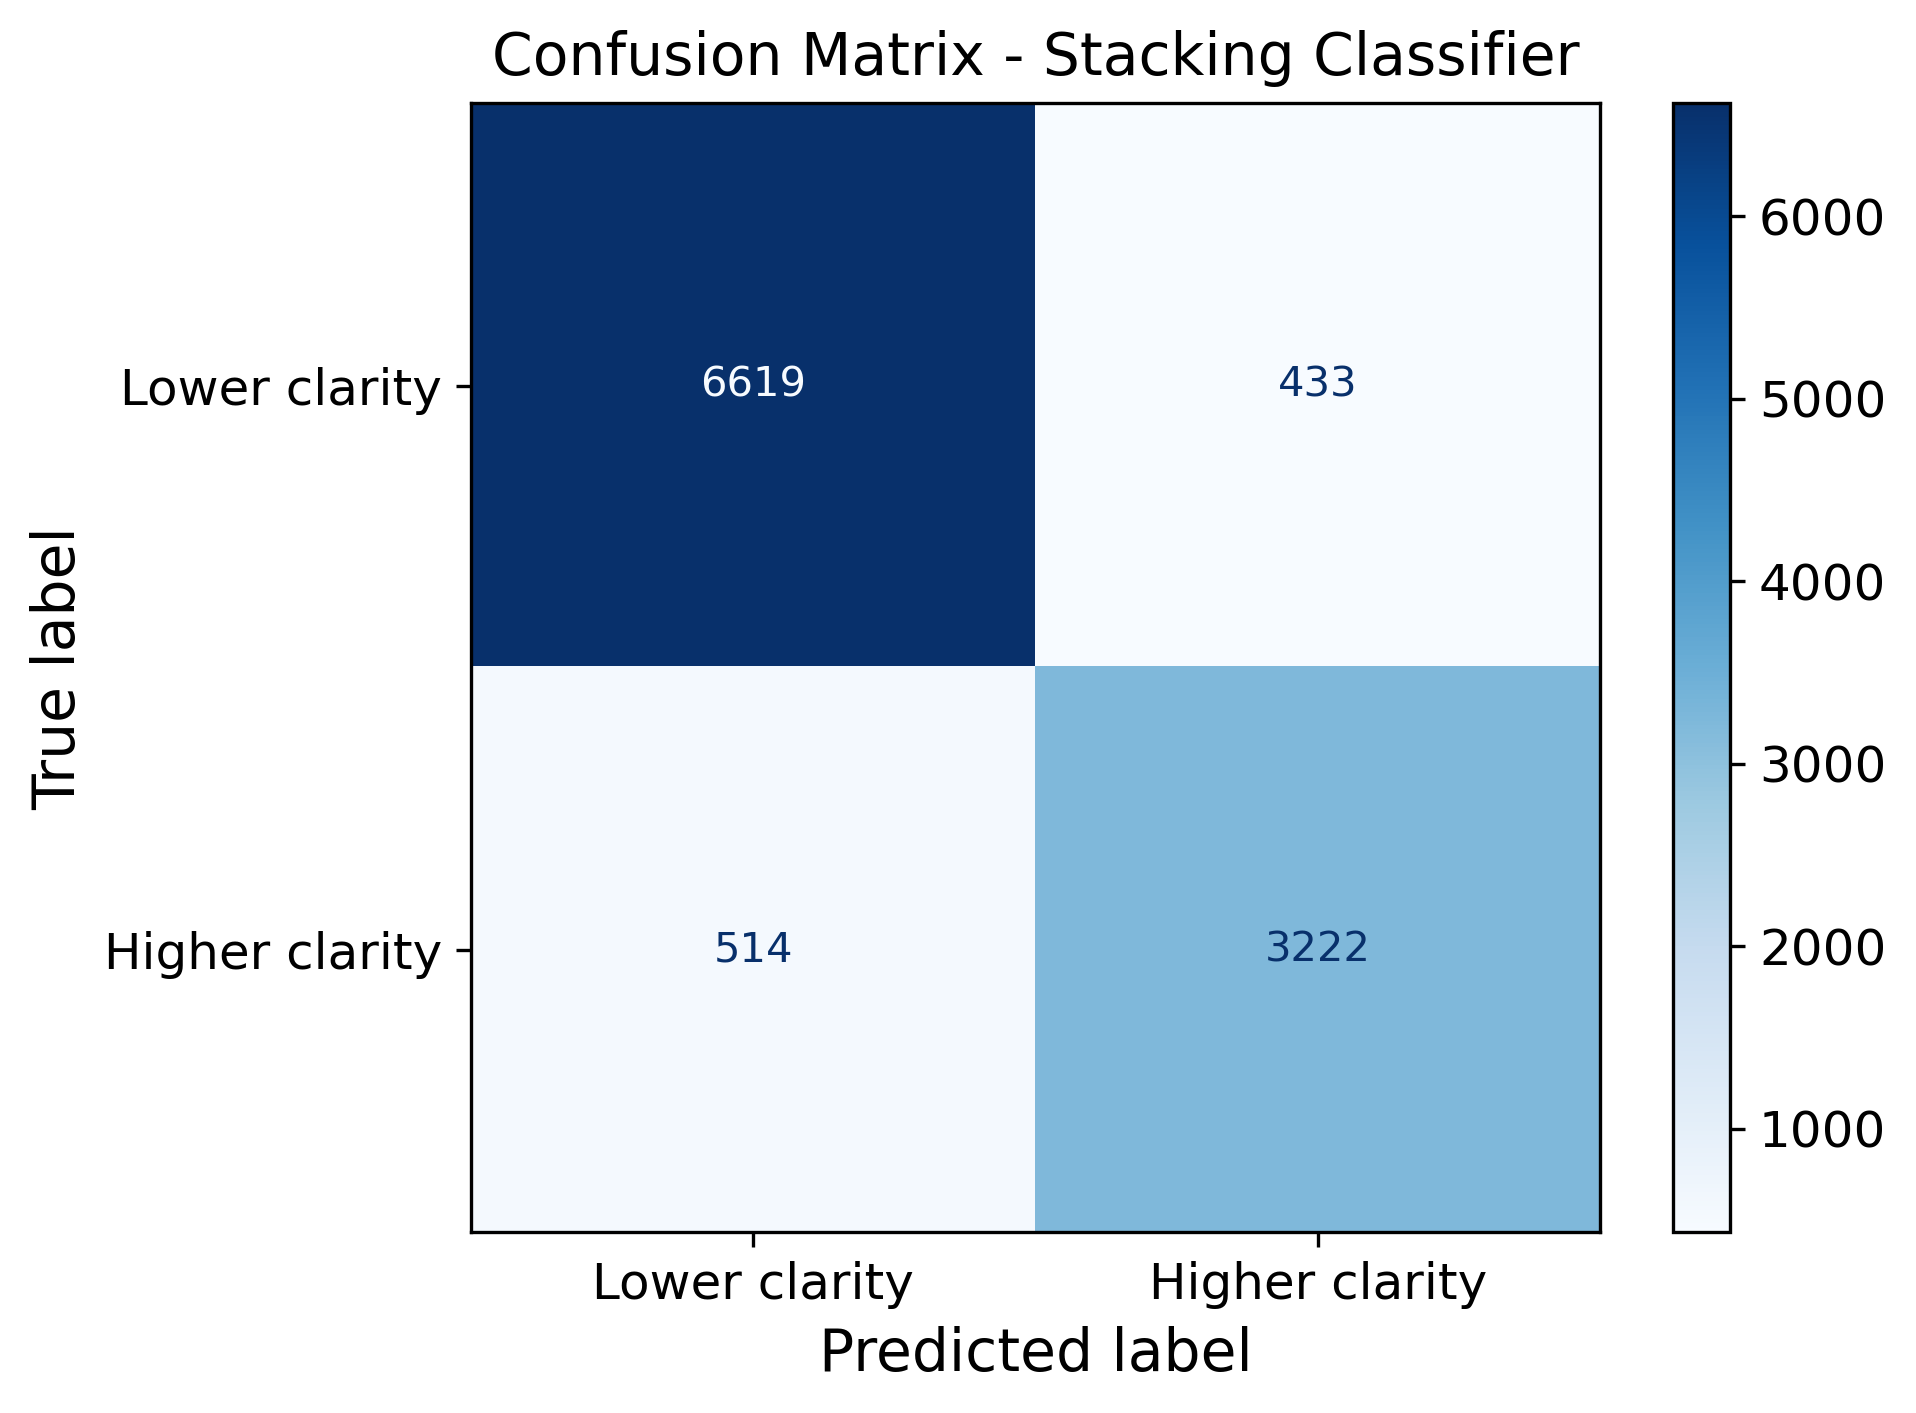
The confusion matrix for the Stacking Classifier was examined separately to provide a clearer view of its correct classifications and remaining prediction errors.

Confusion matrix for the Stacking Classifier, showing correct predictions and the remaining false positive and false negative cases.


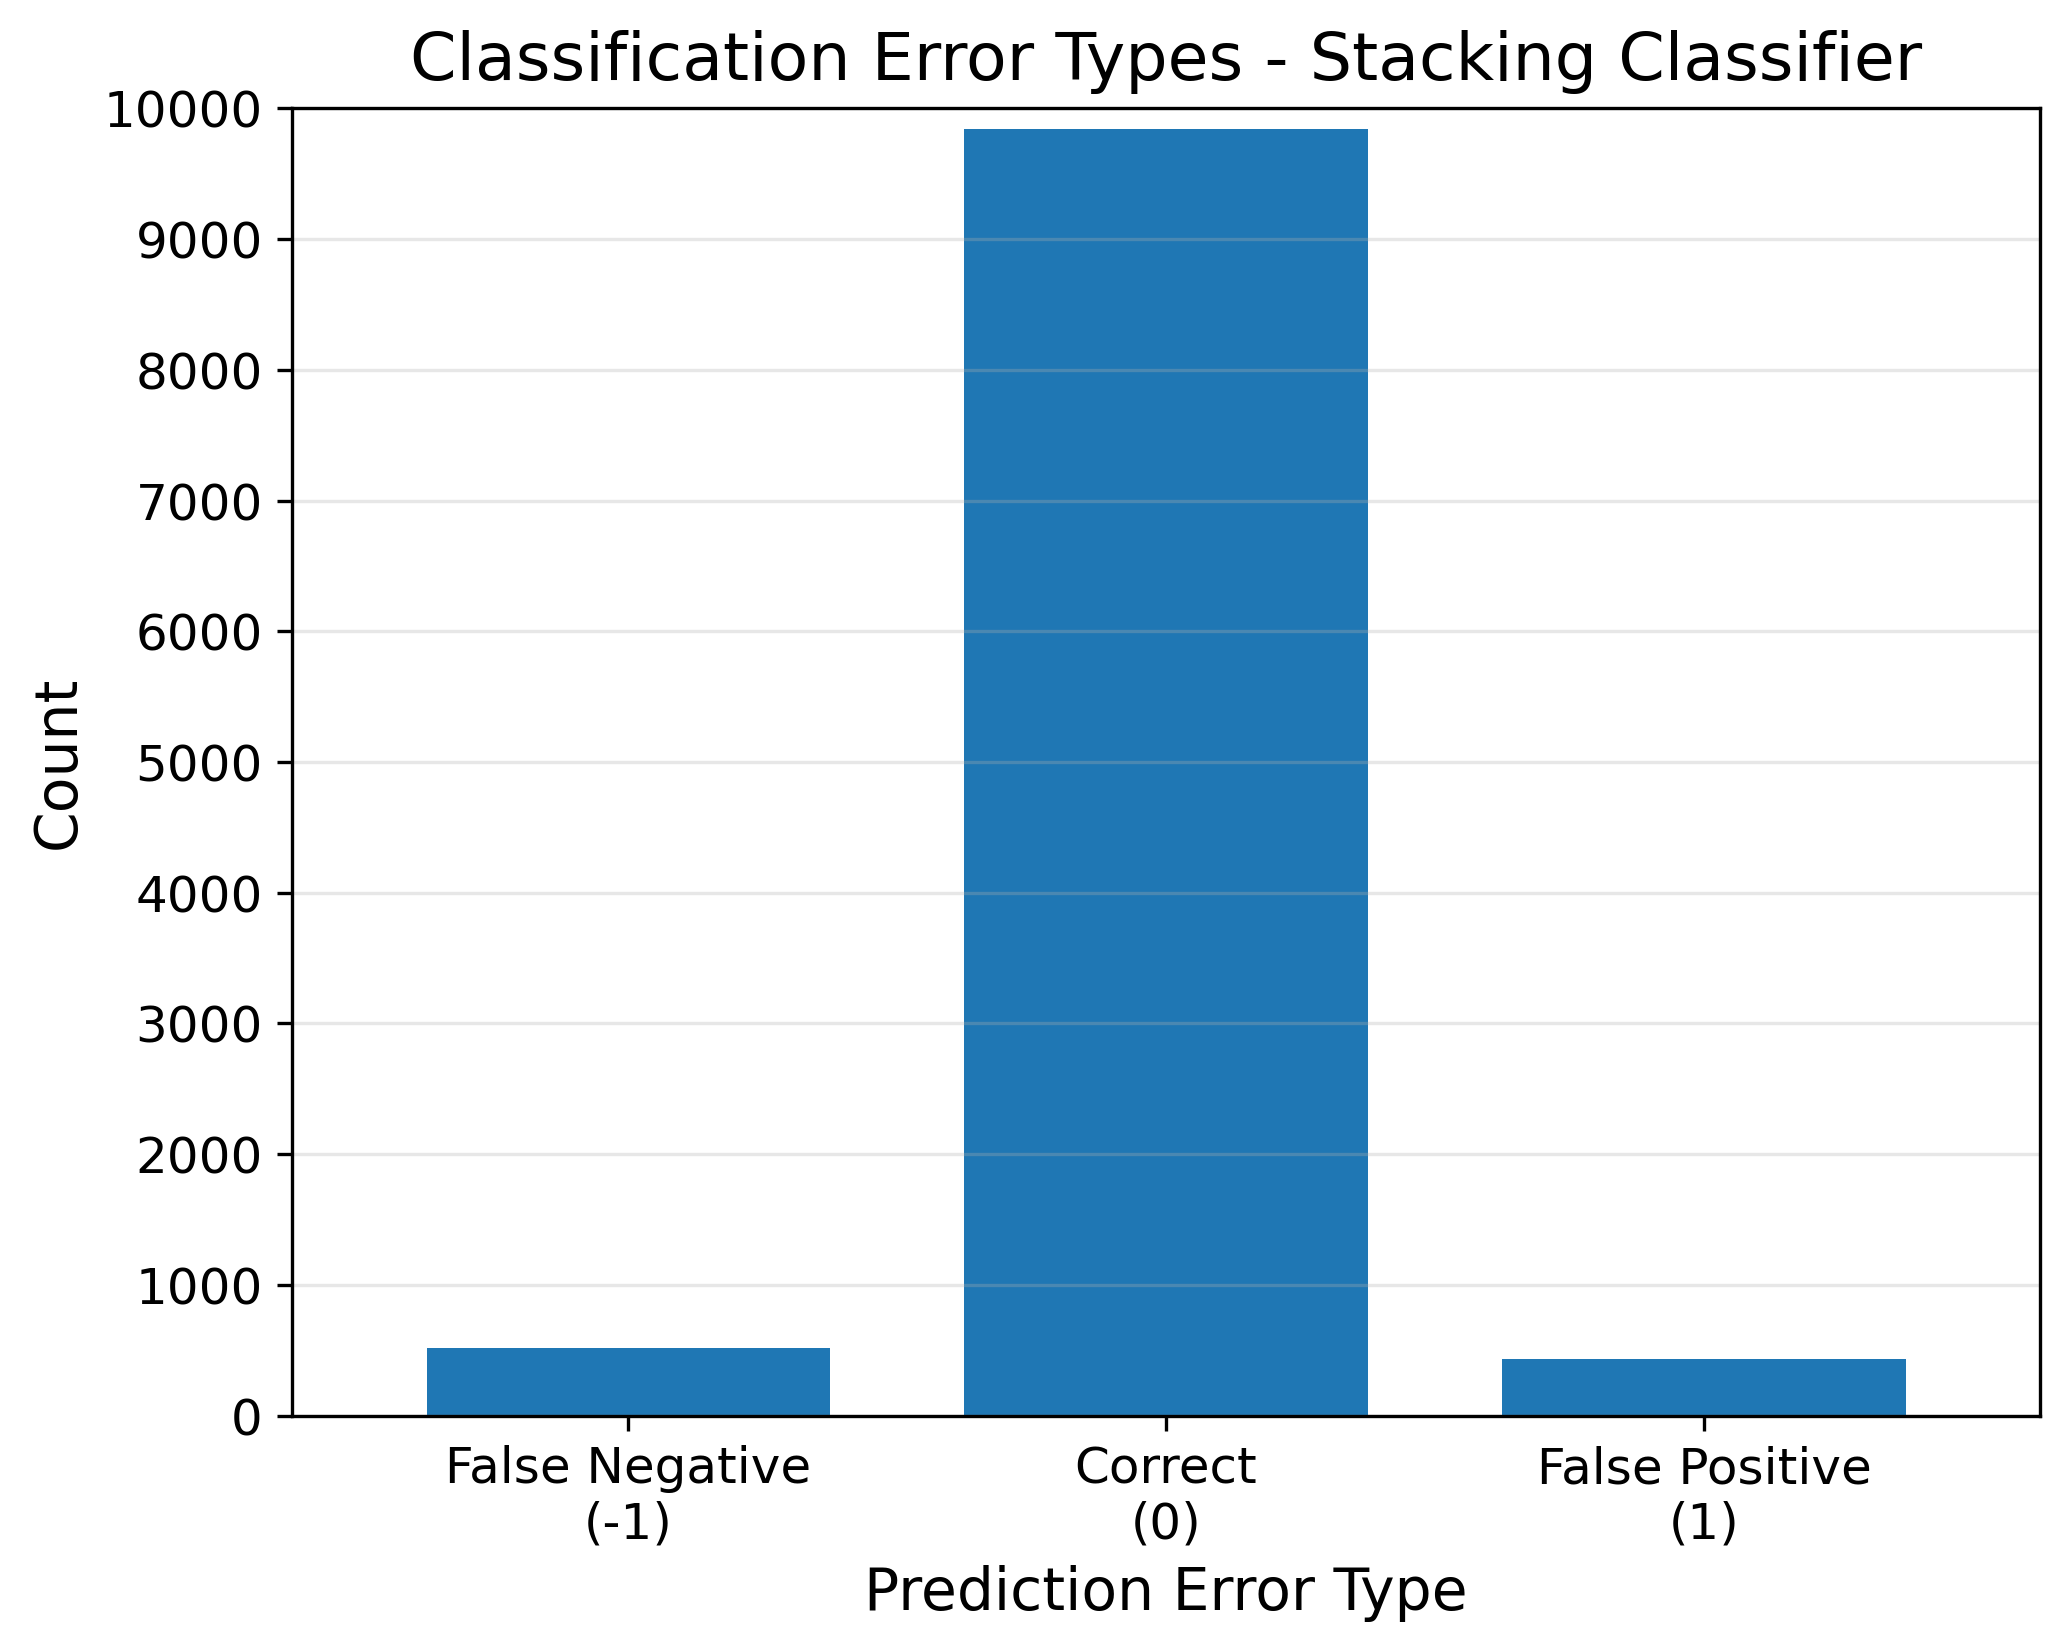
The error pattern of the Stacking Classifier was examined separately to show how its incorrect predictions were distributed between false positive and false negative cases.

Classification error types for the Stacking Classifier, showing the distribution of false positive and false negative predictions.


Following the overall model comparison, the Stacking Classifier was examined in greater detail to better understand its prediction behaviour, errors and the contribution of individual input features.

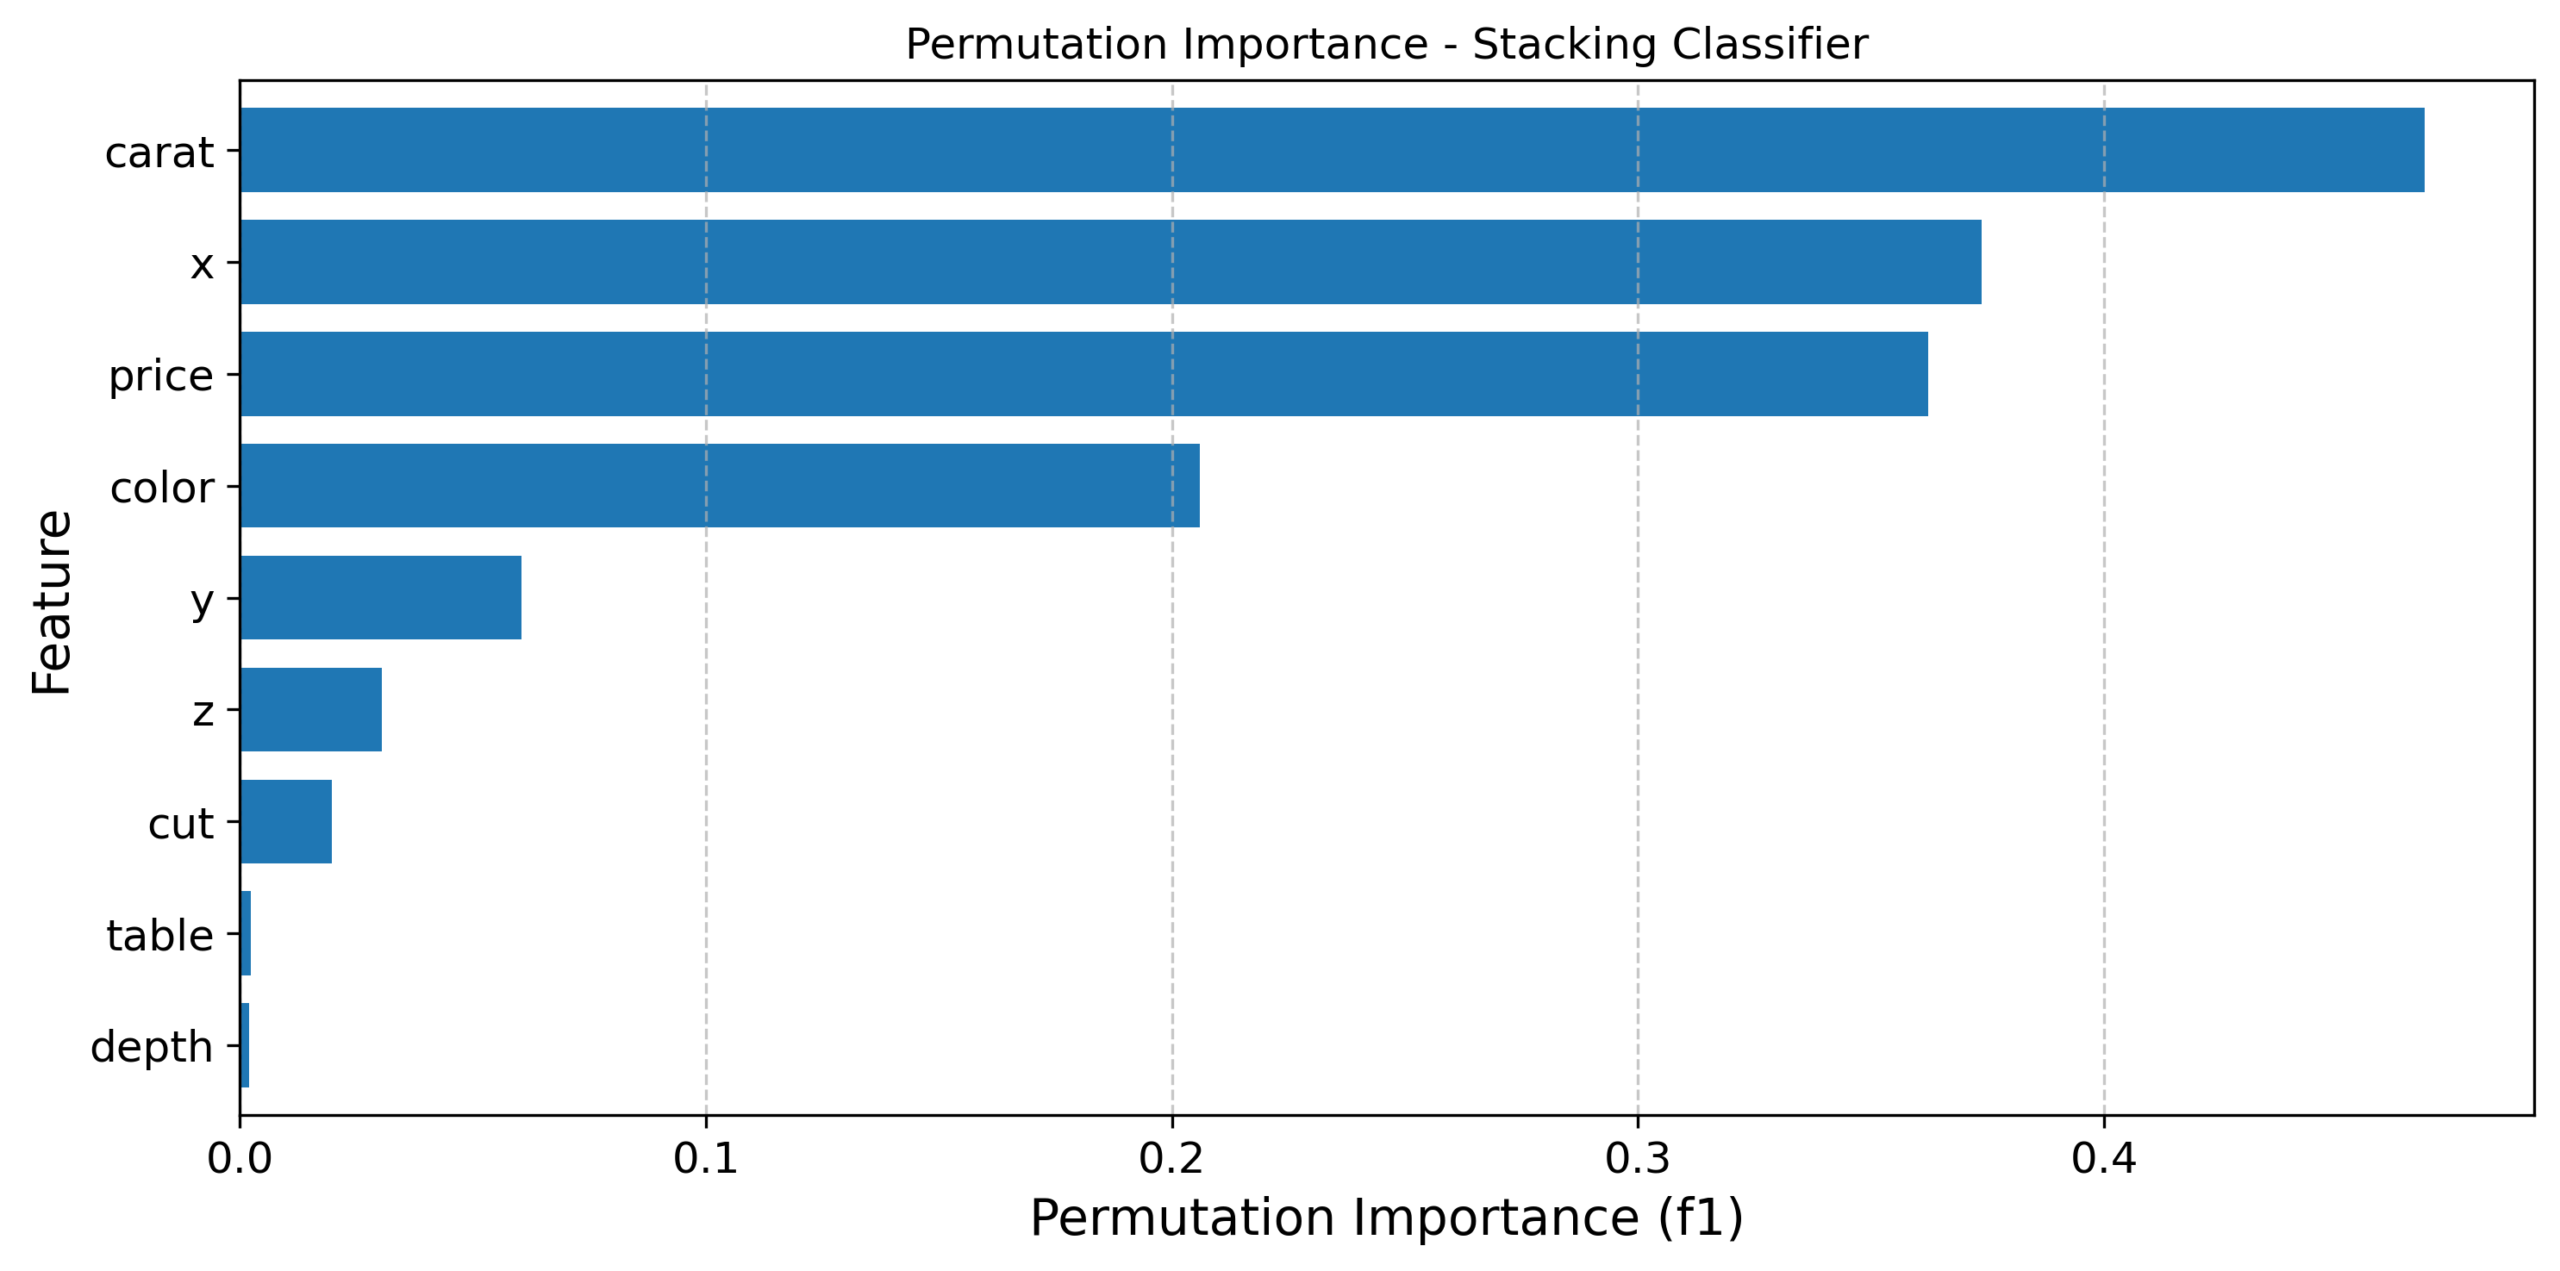
Permutation importance was used to estimate how strongly each input feature contributed to the predictive performance of the selected model.

Permutation importance for the Stacking Classifier, showing the relative influence of the input features on model performance.

Selected test samples were used to compare the predicted classes produced by the different models and to highlight where their decisions agree or differ on individual observations.
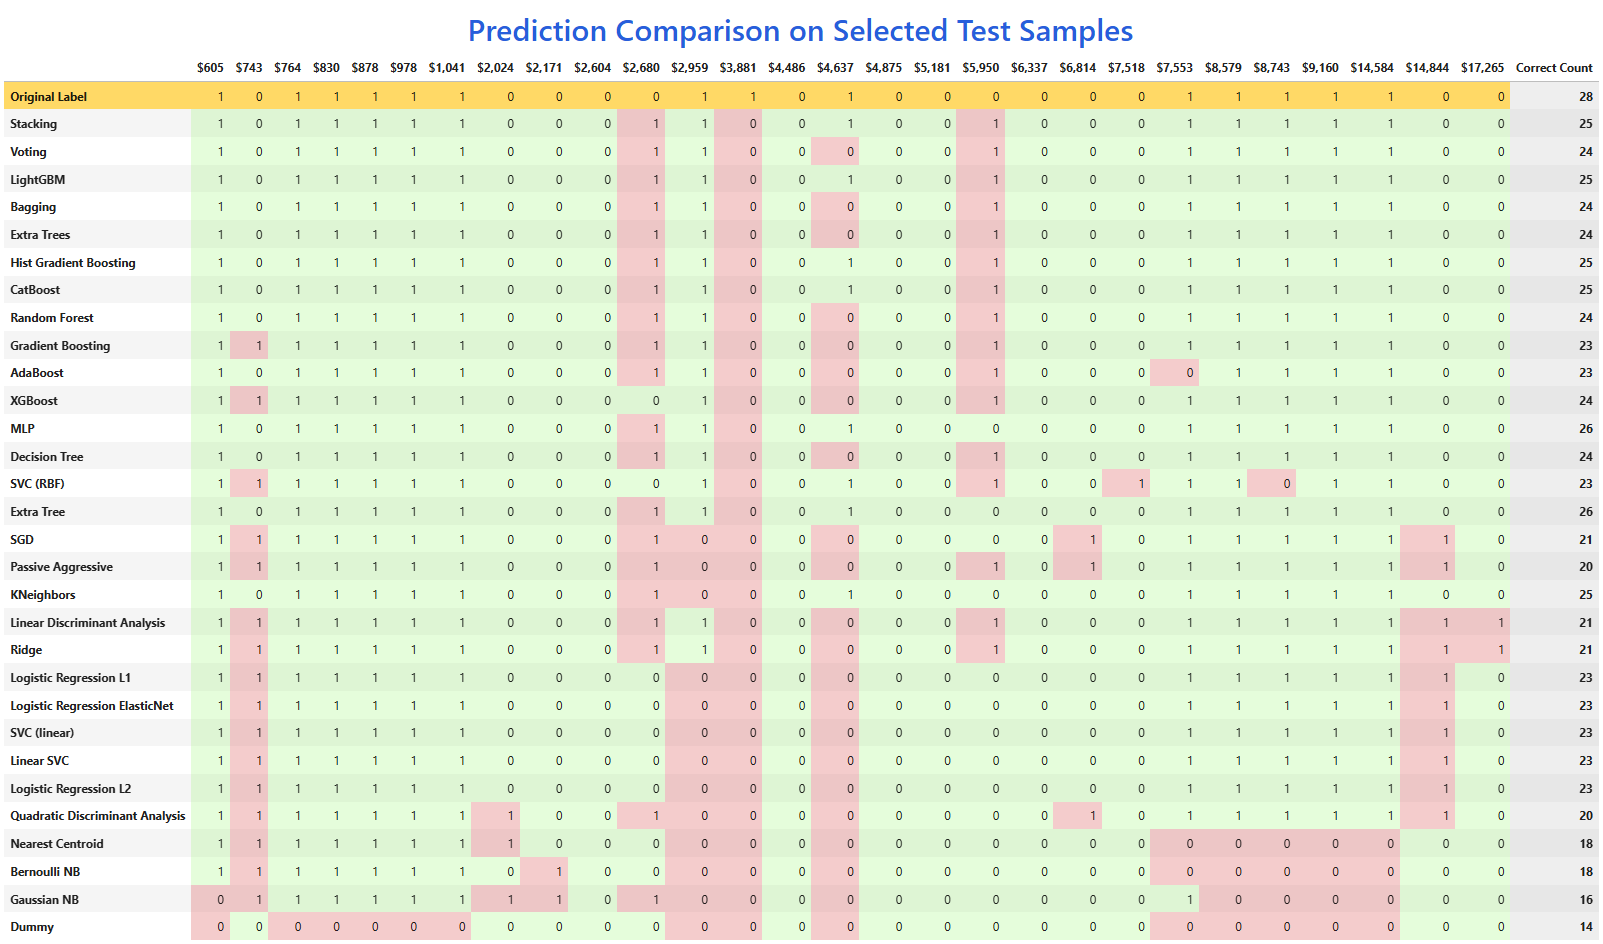
Comparison of predicted classes for selected test samples across the tuned binary classification models.

The selected test samples were also checked specifically against the predictions of the Stacking Classifier to confirm whether the best-performing model classified each example correctly.

Correctness check for the Stacking Classifier on selected test samples, showing whether each prediction matches the actual class.

Decision Threshold Analysis

Different classification thresholds were tested to examine how changing the decision boundary affects precision, recall and F1 score. This helps illustrate how model behaviour can be adjusted depending on the relative importance of false positive and false negative predictions.
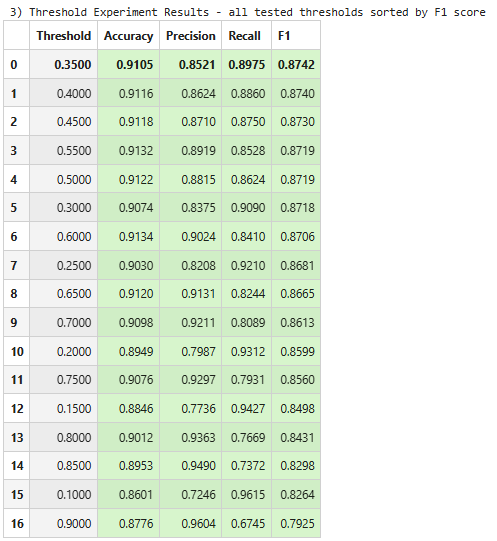
Comparison of classification results across tested decision thresholds, highlighting the trade-offs between precision, recall and F1 score.

Best Model Performance by Price Range

The Stacking Classifier was also evaluated across different diamond price ranges to examine whether its classification performance remained consistent across lower- and higher-value samples.
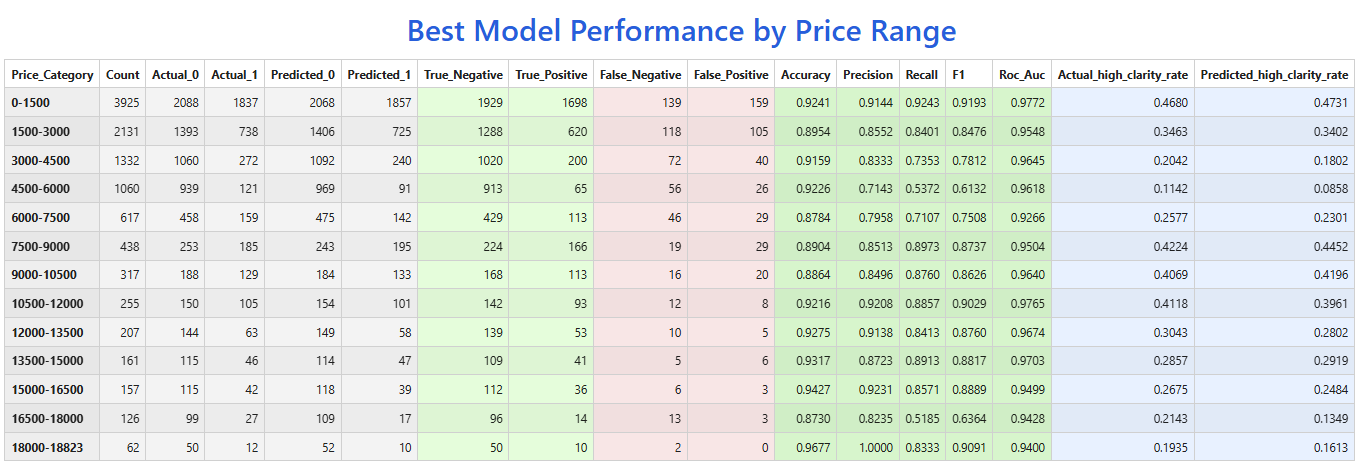
Performance of the Stacking Classifier across different diamond price ranges, showing how classification metrics vary across the target-value spectrum.

Practical Model Comparison

The models were also compared from a broader practical perspective, considering characteristics such as predictive performance, training and prediction speed, memory efficiency, overfitting resistance, scaling requirements and support for continued training.These heuristic ratings complement the measured evaluation results and provide additional context for practical model selection.
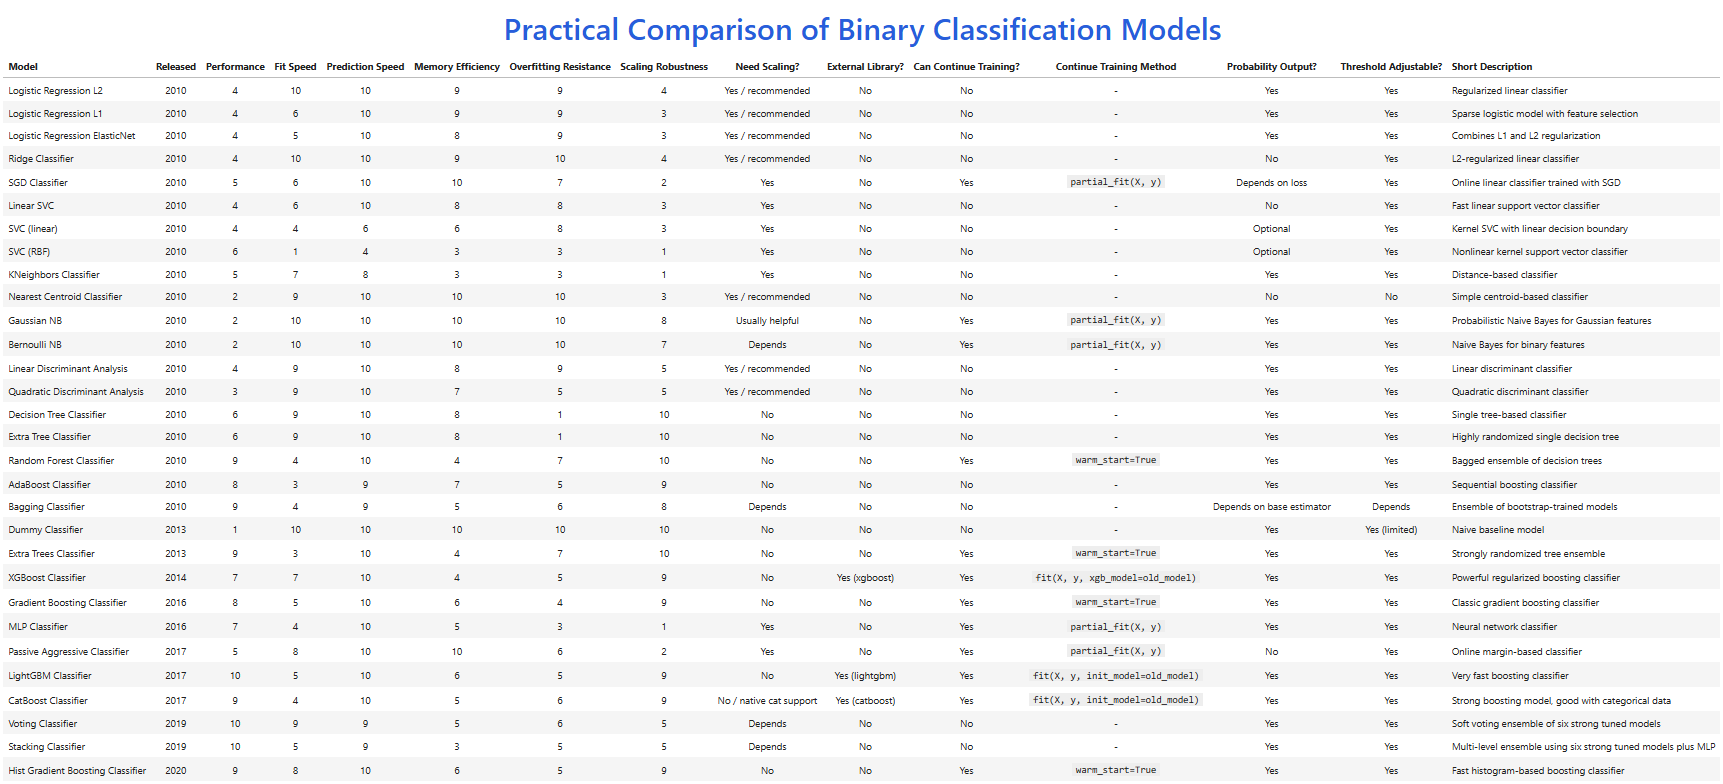
Practical comparison of the binary classification models across performance, computational efficiency, robustness and implementation characteristics.

Why I Built This Project

I built this project to develop a deeper understanding of supervised classification and how different model families behave when solving the same binary prediction problem.

Comparing a broad range of algorithms made it easier to understand why classification models should not be judged using a single metric.

The project also demonstrated how model selection can depend on the type of prediction errors that matter, the quality of probability estimates, computational efficiency and the intended use of the model.

The strongest model therefore is not necessarily the model with the highest headline score, but the one that provides the most appropriate balance for the problem being solved.

Key Skills Demonstrated

This project demonstrates skills in:

  • Python programming
  • pandas
  • NumPy
  • scikit-learn
  • supervised machine learning
  • binary classification
  • data preprocessing
  • classification metrics
  • model evaluation
  • probability-based evaluation
  • cross-validation
  • hyperparameter tuning
  • model comparison
  • performance analysis
  • runtime analysis
  • prediction analysis
  • data visualisation
  • practical model selection
  • technical documentation
  • GitHub project presentation

What I Learned

Through this project, I developed a stronger understanding of the complete binary classification workflow and the differences between major classification model families.

I gained practical experience in interpreting classification metrics, analysing prediction probabilities and comparing models from several perspectives rather than relying on accuracy alone.

The project also helped me improve my understanding of cross-validation, hyperparameter tuning, model evaluation and the trade-offs involved in selecting a model for practical use.

In addition, I further developed my Python workflow, experimental structure, data visualisation, technical documentation and ability to communicate machine learning results clearly.